Observability

Observability

Observability - The Complete Story - from metrics, logging, to tracing

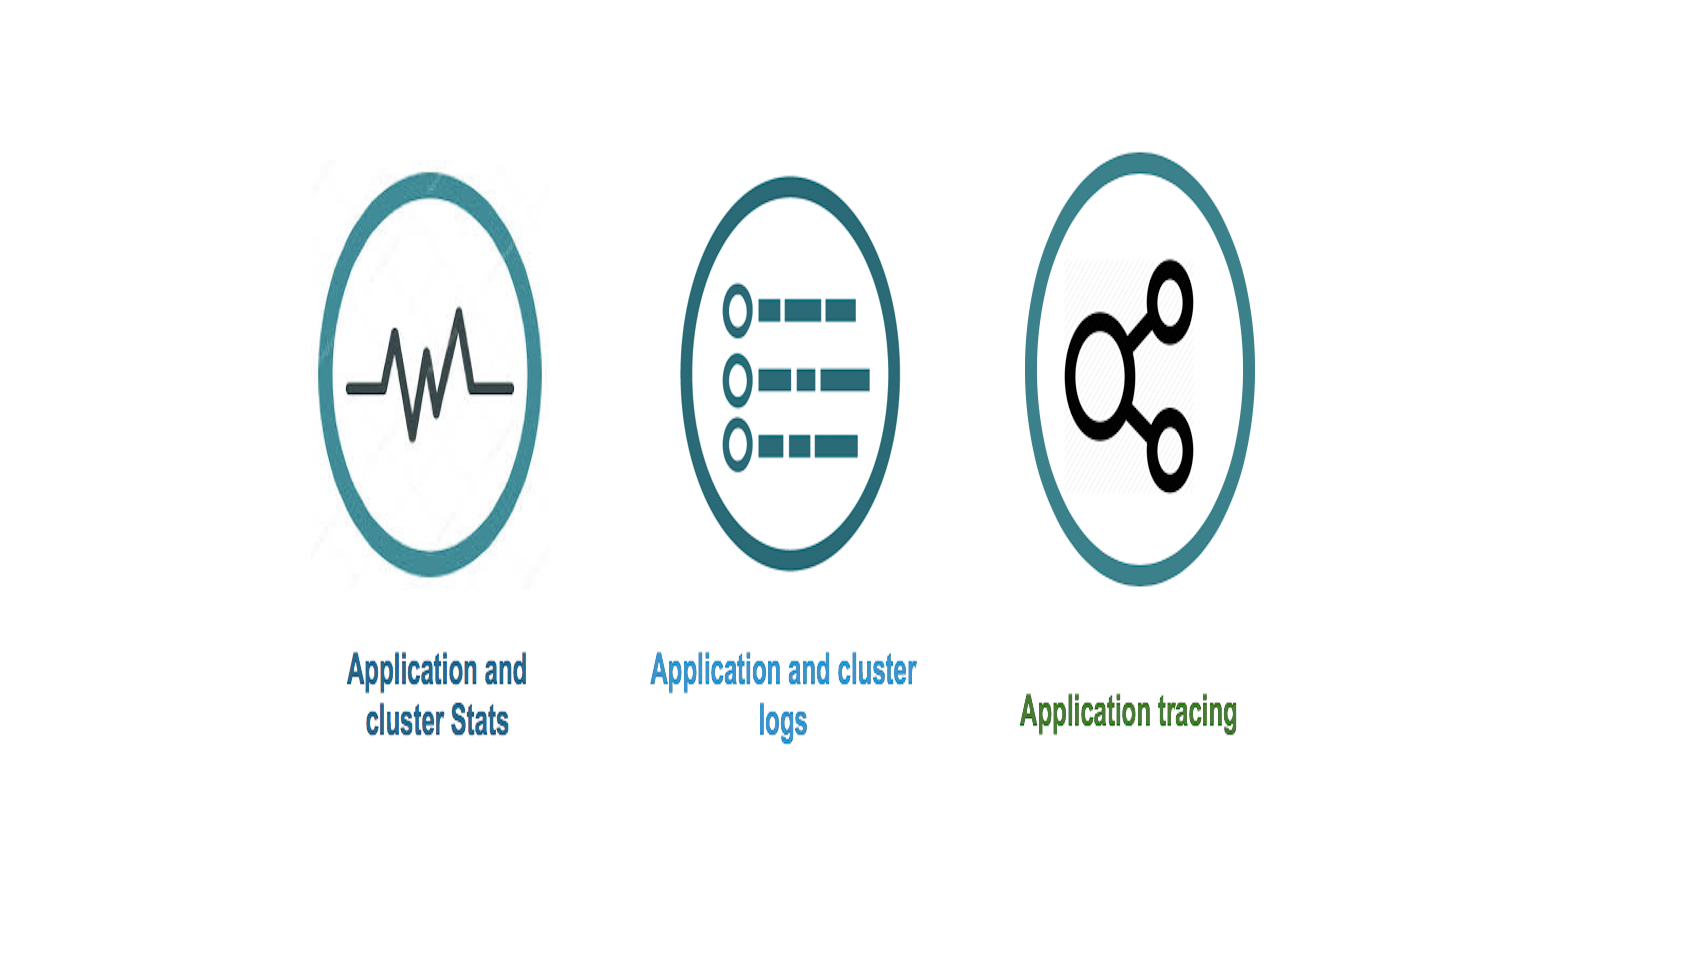
In managing applications deployed on Kubernetes, developers have a significant number of options to choose from. These options cover both open source, and commercial options and cover three main categories: Metrics — are a numeric representation of data measured over intervals of time. And you can use mathematical modeling and prediction to derive the behavior of the system over an internal of time - either present or the future. Hence, metrics are useful for monitoring but more powerful when enabled with analysis mechanisms such as correlation and anomaly detection.

Continue Reading
Observability

Configuring fluentd on kubernetes with AWS Elasticsearch

In a previous blog we discussed the configuration and use of fluentbit with AWS elasticsearch. https://medium.com/@bahubalishetti/configuring-fluentbit-on-kubernetes-for-aws-elasticsearch-bec486bcc727 It helped provide a basic configuration of “logging” from a Kubernetes cluster. “Logging” is one aspect of “Observability” in Kubernetes. Lets review: Observability for the cluster and the application covers three areas: Monitoring metrics — Pulling metrics from the cluster, through cAdvisor, metrics server, and/or prometheus, along with application data which can be aggregated across clusters in Wavefront by VMware.

Continue Reading
Observability

Configuring Fluentbit on Kubernetes for AWS Elasticsearch

As noted in one of my earlier blogs, one of the key issues with managing Kubernetes is observability. Observability is the ability to gain insight into multiple data points/sets from the Kubernetes cluster and analyze this data in resolving issues. As review, observability for the cluster and application covers three areas: Monitoring metrics — Pulling metrics from the cluster, through cAdvisor, metrics server, and/or prometheus, along with application data which can be aggregated across clusters in Wavefront by VMware.

Continue Reading