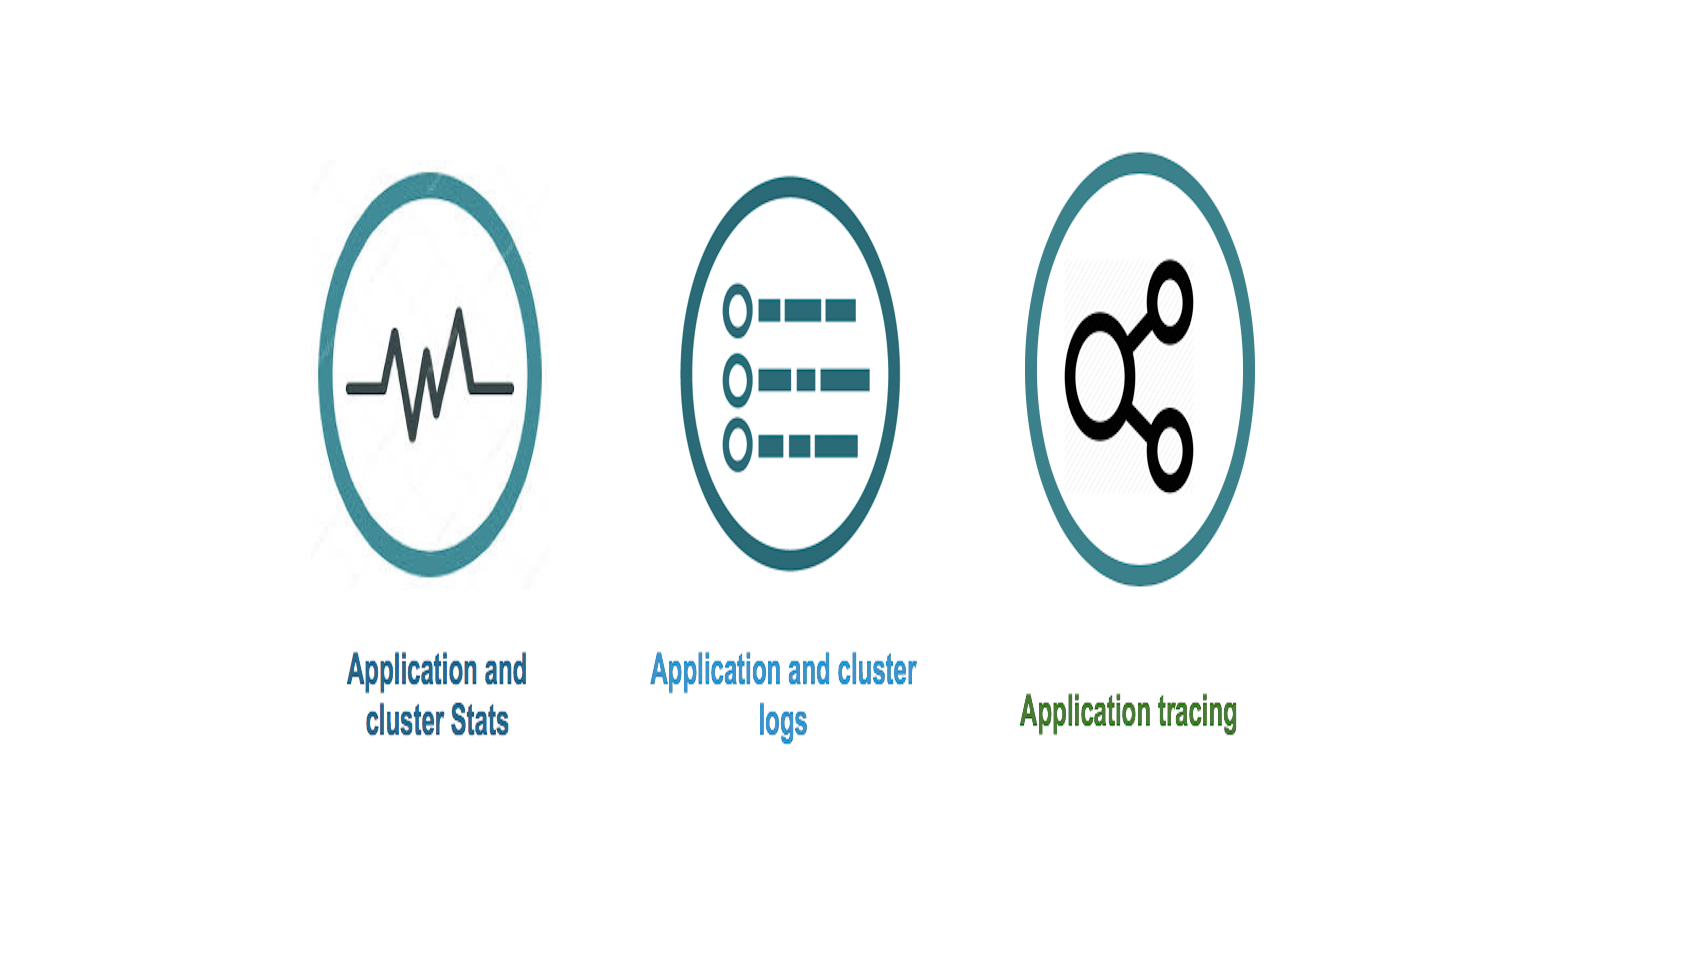
In managing applications deployed on Kubernetes, developers have a significant number of options to choose from. These options cover both open source, and commercial options and cover three main categories:
-
Metrics — are a numeric representation of data measured over intervals of time. And you can use mathematical modeling and prediction to derive the behavior of the system over an internal of time - either present or the future. Hence, metrics are useful for monitoring but more powerful when enabled with analysis mechanisms such as correlation and anomaly detection. Not all options have this combination. Wavefront by VMware has this combination
-
Logs — Logs are easy human readable, structured bits of information from a specific point in time. However there is a significant amount of this data and you have to you log aggregation tools like Elas ticsearch, Splunk etc to index and analyze the information.
-
Tracing — Tells an end to end story for an application by “stitching” bits of a flow into an easily digestible format. Popular open source tools include Zipkin and Jaeger.
Individually each category can help specific issues. However together these three categories can provide powerful analysis mechanism for application issues. These three constitute what is known in the cloud native world as Observability.

This blog will provide a quick overview of observability, and work through each of these components. We will reference articles in the industry and from our own site CloudJourney.io.
Logging
Logging is the most used and well known component in Observability. Every developer and/or DevOps lead collects and analyzes logs for applications and their environments. The abundance of logs and the significant amount of information requires a proper architecture and plan to aggregate and analyze this information. With Kubernetes, logs have to be aggregated for:
- Kubernetes cluster - Nodes, Pods, containers, K8S APIs, etc.
- Application - output from each service needs to be collected properly
- Cloud - whether its use of AKS, EKS, etc you will need to potentially analyze against these components also.
The best way to work through a logging solution is by understanding what you are collecting, re-structuring the data (normalizing), and selecting a scalable location to aggregate the data.
In aggregating logs, there are two main options:
-
Commercial SaaS service – Splunk, Logz.io, etc are commonly used. Where you can get both forwarding and aggregation end points all under one roof.
Splunk, one of the most popular commercial aggregation services. Regardless of an enterprise service (on-prem) or a SaaS service, Splunk provides both. Getting the information into Splunk you can use collect and forward to a Splunk end point with Splunk Connect for Kubernetes
-
Custom built - A more normally used configuration. This involves using some combination of open source components and/or commercial components.
Elasticsearch Aggregation + Fluentd - Is becoming an increasingly popular choice for its ability to index and the availability of various options, such as the commercial version from Elastic or even AWS Elasticsearch. Most of these architectures will use Fluentd or FLuentbit to forward to Elasticsearch. In a previous article we explored one such configuration Fluentbit to AWS Elasticsearch
In either solution, all logs are generally collected from the cluster and sent to the aggregation location (on-prem and/or the cloud). The solutions alone will not provide everything. Generally the standard configuration is to report ALL basic Kubernetes based logs for nodes, pods, etc. All the Kubernetes bits.
Its important to ensure that developers configure their applications to log. We’re in 2019, this process should be standard hygiene for most developers. However there are always exceptions. There are numerous articles showing how to instrument an application to log.
However, the ability to collect these logs in an application is more complex. There are several architectures outlined in Kubernetes Logging.
Selecting the proper application architecture for your Kubernetes deployment is the choice of the developer.
Metrics
Metrics unlike logging is not as prominent in the application space. Metrics for monitoring the developers build environment (i.e. CI/CD process, the environment performance with the application, database service performance, etc) is very popular.
Any tool/solution detailed on the internet generally outlines getting metrics up and showcases Kubernetes metrics. The output shown is generally surrounding node, pod, namespace, etc stats. Application metrics? That is a whole other story.
In managing an application BOTH Kubernetes and application stats are needed.
Similar to logging, a metrics aggregation solution is needed. While individual solutions per cluster are generally outlined, a mechanism to aggregate metrics is much harder.
Again, similar to logging, there are two main options:
-
OpenSource/Custom built -
These solutions generally use prometheus in each cluster, and tools like grafana. Aggregation across clusters is much harder.
A popular solution is using a singular Prometheus aggregation instance per cluster to gather data from all the individual Prometheus cluster instances, then aggregating them into a larger prometheus instance. Solutions for this option are outlined in various blogs, and articles. A popular solution is to use Prometheus Federation. A newer solution using Thanos to aggregate with highly available storage is also becoming popular.
-
Commercial solutions with some opensource -
Using a tool like Wavefront by VMware or Datadog is an interesting option. The aggregation of metrics is managed as part of the SaaS service these offer, hence relieving the admin from managing the backend. If security, cost and other administrative hurdles are crossed for your enterprise, these are ideal solutions to use.
Not only is the aggregation simple, but the collection of metrics is also simple. Wavefront by VMware uses a standard deployment of collecting Kubernetes metrics from the Kubernetes Metrics Server, and providing aggregated views. We’ve outlined several such configurations in the following blogs:
- Monitoring Kubernetes Cluster and Istio Metrics
- Full stack kubernetes observability
- Hands free Kubernetes monitoring
Application Metrics
In addition, we’ve also outlined how to use open source metrics collectors like Telegraf as a sidecar to extract stats from different application components such as Flask, Django, and mysql. And show case how to send this to Wavefront by VMware. The following article outlines this:
Analysis Capabilities
In addition to gathering and displaying metrics properly, analysis is the hardest aspect. Luckily Wavefront by VMware has great capabilities
Hence in addition to getting Kubernetes based metrics from either Prometheus or commercial tools like Wavefront, its very important to also pull in application metrics. With out this there isn’t a complete picture.
Tracing
Modern applications, especially with a microservices architecture, use many interconnected services. This makes troubleshooting harder because of the increase in the number of points of failures.
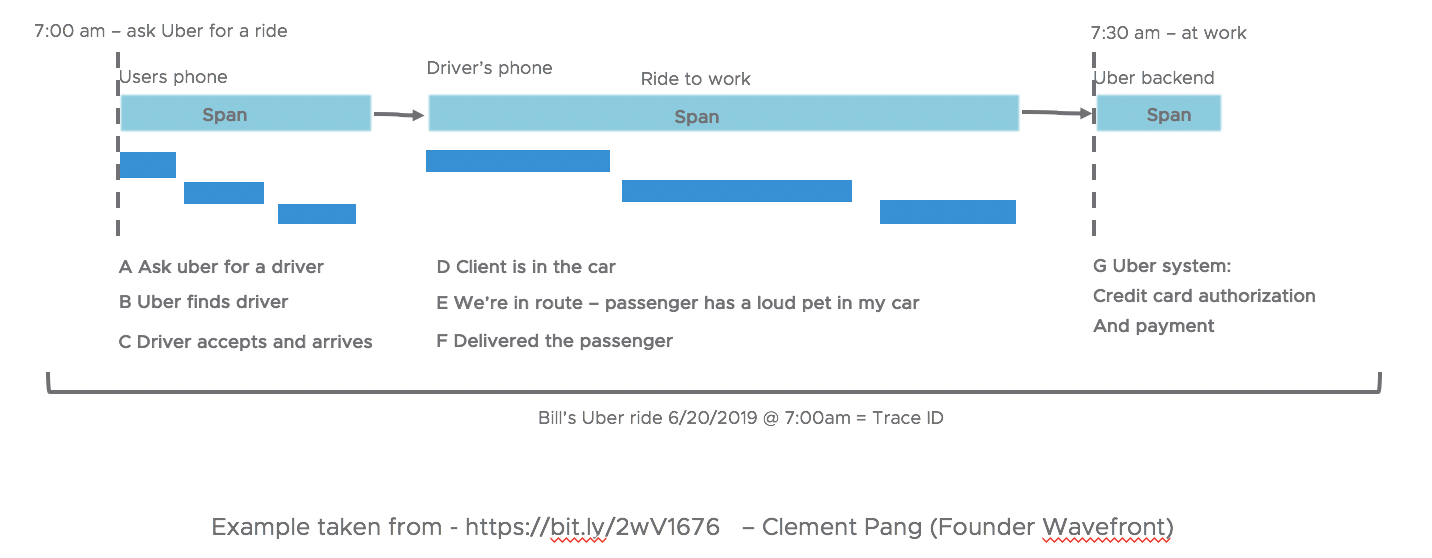
Let’s look at an example of a ride-sharing app, and the possible series of events that occur from interaction with the app.

As noted in the image above several sequences and actions take place:
On Passenger’s Phone:
- A passenger requests a ride from the app.
- The ride-sharing app finds a driver.
- A notification of the driver’s arrival is sent.
On Driver’s Phone:
- The passenger sits in the car.
- Time-to-travel is estimated and tracked for pricing.
On Ride-sharing Platform’s Backend:
- The total cost is calculated.
- A credit card is authorized.
This end-to-end request tracking across various systems and services is called Distributed Tracing. A distributed trace is comprised of multiple spans, and each span contains some baggage item plus context that helps in debugging and troubleshooting issues.
The goal of Distributed Tracing is to pinpoint failures and causes of poor performance across various system boundaries. It enables users to pinpoint the service or granular, the specific request path, that is causing the issue. You can also attach logs and tags to traces to further reduce noise while debugging.
Different options
There is a wide range of frameworks, libraries, and tools out there, both open-source and commercial that try to solve issues related to Distributed Tracing.
Opensource - Some of the popular open-source tracing tools are Zipkin, Jaeger. What to choose?
- Both have significant amount of language support – roughly equal (Zipkin doesn’t have an official python library while jaeger doesn’t have an official ruby library)
- Docker vs K8S - Implementation wise – Zipkin is better for docker and java based application by far, and is probably best with docker compose Jaeger on the other hand is part of the CNCF and prefers a K8S deployment
- Zipkin is a single process which includes the reporters, collectors, storage, Api and UI VS Jaeger – while similar in components and adds an agent but is deployed as multiple components (or with all in one option also)
Commercial - Wavefront, Datadog, Lightstep, etc. All of these have an agent (with services or as a sidecar), collector, and UI.
We’ve outlined a set of options around Wavefront by VMware:
-
Aggregating views and analysis of Tracing: Opentracing with Jaeger and Wavefront How to use application traces in Wavefront
-
Instrumenting Tracing in applications: Application instrumentation in Go/NodeJS/Python 7 Best Practices to Distributed Tracing
Application instrumentation is HARD. The articles above hopefully provides an appreciation of the complexities in making this happen.
In short Tracing is Hard. The hardest category of Observability
- Tracing requires the application to be instrumented (i.e. developers have to write code within their services).
- The Tracing code needs to be written for every single request path across all the services. This requires working knowledge of the entire application and needs some co-ordination.
- Every request now needs to carry additional information, which means the requests may have to be modified based on how the application was structured.
- Complexity increases with the use of different frameworks and programming languages within the application. There might be inconsistencies with some of the interfaces.
Using any of these tools (OpenSource or Commercial) and their specific components results in vendor lock-in, making it harder for developers to work because not all vendors have the same support across different frameworks and libraries.
To solve this problem, OpenTracing and OpenCensus projects were started. They provide what other frameworks and libraries can implement. This enables developers to add instrumentation to their application code that won’t lock them into any particular vendor. This low coupling, along with easy-to-use Interfaces, makes these two projects very attractive.
Conclusion
Hopefully the blog has provided an appreciation of the various options, solutions, and complexity surrounding observability for Kubernetes.
- Logging - the most commonly understood with the most number of solutions options. Its also the only category with the best developer hygiene. Its commonly and widely implemented in the app.
- Metrics - slowly starting to be properly instrumented in the app, but most metrics are still environment based.
- Tracing - the newest and most complex. But the category providing the most information.
Combining all three of these in an Observability plan is important to get the most complete picture of application’s issues.
