
While I may not be an application developer in the purest sense, I have been working with and around application Developers and teams for many years now. I have worked side by side applications teams that have build in-house applications, Commercial-off-the-shelf (COTS), as a service, etc.
Applications and Car’s having something in common: Performance Tuning
I was once an Application Owner
I owned a few COTS (Infrastructure) applications throughout the years and I had to develop testing plans. While I may not have been responsible for the code; nor did I define the minimum requirements, but I developed and ran performance tests.
The first application I owned was Microsoft Systems Management Server (SMS); now known as Microsoft System Center Configuration Manager (SCCM) and this required that I design, implement and manage the application from the ground up! The Environment would spanned 3 datacenters, 110 branch office locations across the US and UK with over 30,000 users and assets fully managed with SMS/SCCM. One caveat was that each of the branch office locations only had a single server. That server acted as a Windows Domain Controller; Active Directory and DNS, and I was tasked with deployed Microsoft SCCM Member Servers on top. Don’t talk to me about the security ramifications of this! Trust me; I pushed back on the consulting firm, but ultimately lost this security battle because of a lack of budget.
Back to the Performance Tests
The performance test plan included simulated logins, DNS lookup requests, package uploads/downloads, etc. My mind is still littered with the Microsoft System Center Operations Manager dashboards telling me if these 1U servers (without redundancy) would be able to handle the load. Without going into great detail, some of the physical server were either unable to handle the workload (or old enough) that they would not perform optimally and I was able to setup separate Members Service anyway.
This blog will walk us through the concepts, goals and tools used for application Performance Testing through the lense of the Infrastructure. To highlight this a bit further in a modern sense, I am going to look at Kubernetes and how our team utilizes Performance tests for the ACME Fitness (Demo) application and where these test fit into the CI/CD pipeline to highlight real world scenarios that each you go through on a daily basis.
Disclaimer Detailing every Performance Test, methodology and metric would take a long time! For this blog, I will keep things simple and high level while focusing on a few very specific concepts.
Components to Performance Testing
application Developers have used performance testing as a part of the Software Development Life Cycle (SDLC) for a long time! Below are a few of the focus areas and definitely not all encompassing.
- Test Types
- Test Goals
- Test Methodologies
- Test Monitoring
Test Types
- Load - Understand expected behavior
- Stress - Upper limits of capacity
- Spike - Sudden increase/decrease behavior
Check out the fantastic read about Software Performance Testing from the community on Wikepedia if you want a more in depth review or you need a bit of a refresher.
Test Goals
- Infrastructure limitations
- Web Server limitations
- API response
- Regression Discovery
Test Methodologies
- Baselines
- User Walkthrough/Journey
- Requirements
- Acceptance Criteria
Test Monitoring
- Tooling
- Output
Kubernetes Infrastructure Performance Testing (in the Pipeline)
For the purposes of this demonstration, we’re going to be using the following tools:
- Source Repository & CI/CD Pipeline: GitLab
- Load Testing Tool: Locust
- Performance Metrics/Data Source: Wavefront
- Infrastructure Location: Azure Kubernetes Service (AKS)
- Application: Acme Fitness
The Process
The Pipeline
This pipeline utilizes Gitlab for the pipeline, repository, etc. You can checkout a similar blog on the topic of Being Budget Conscious in a Continuously Automated World.
Overall Configuration
The pipeline is setup as described below:
WavefrontCheck:
  stage: PerformanceCheck
  environment:
    name: staging
  image:
    name: retgits/wavefront-pod-inspector:latest
    entrypoint: [""]
  script:
    - export GITLAB_TOKEN=$LEON_TOKEN
    - export API_TOKEN=$WFTOKEN
    - export CI_PROJECT_NAME=$CI_PROJECT_NAME
    - echo calling Wavefront to get $METRIC details for pod $POD_NAME
    - /bin/entrypoint.sh
    - if [ $abc = "failed" ]; then echo "Alert" && exit 1 ; else echo "Within range. Continuing!"; fi
  tags:
    - Dedicated

TrafficGenerator:
  stage: PerformanceCheck
  image:
    name: gcr.io/vmwarecloudadvocacy/locust:latest
  script:
   - chmod +x /app/traffic_gen.py
   - python3 /app/traffic_gen.py
  tags:
   - Dedicated

DeployProduction:
  stage: deploy_production
  environment:
    name: production
  image:
    name: bitnami/kubectl
    entrypoint: [""]
  script:
    - kubectl create namespace $GITLAB_USER_LOGIN -o yaml --dry-run | kubectl apply -f -
    - kubectl apply -n $GITLAB_USER_LOGIN -f /builds/vmware-cloud-advocacy/vmworld2019/app/kubernetes/kubernetes-manifests/
  tags:
    - cluster
    - kubernetes
    - production
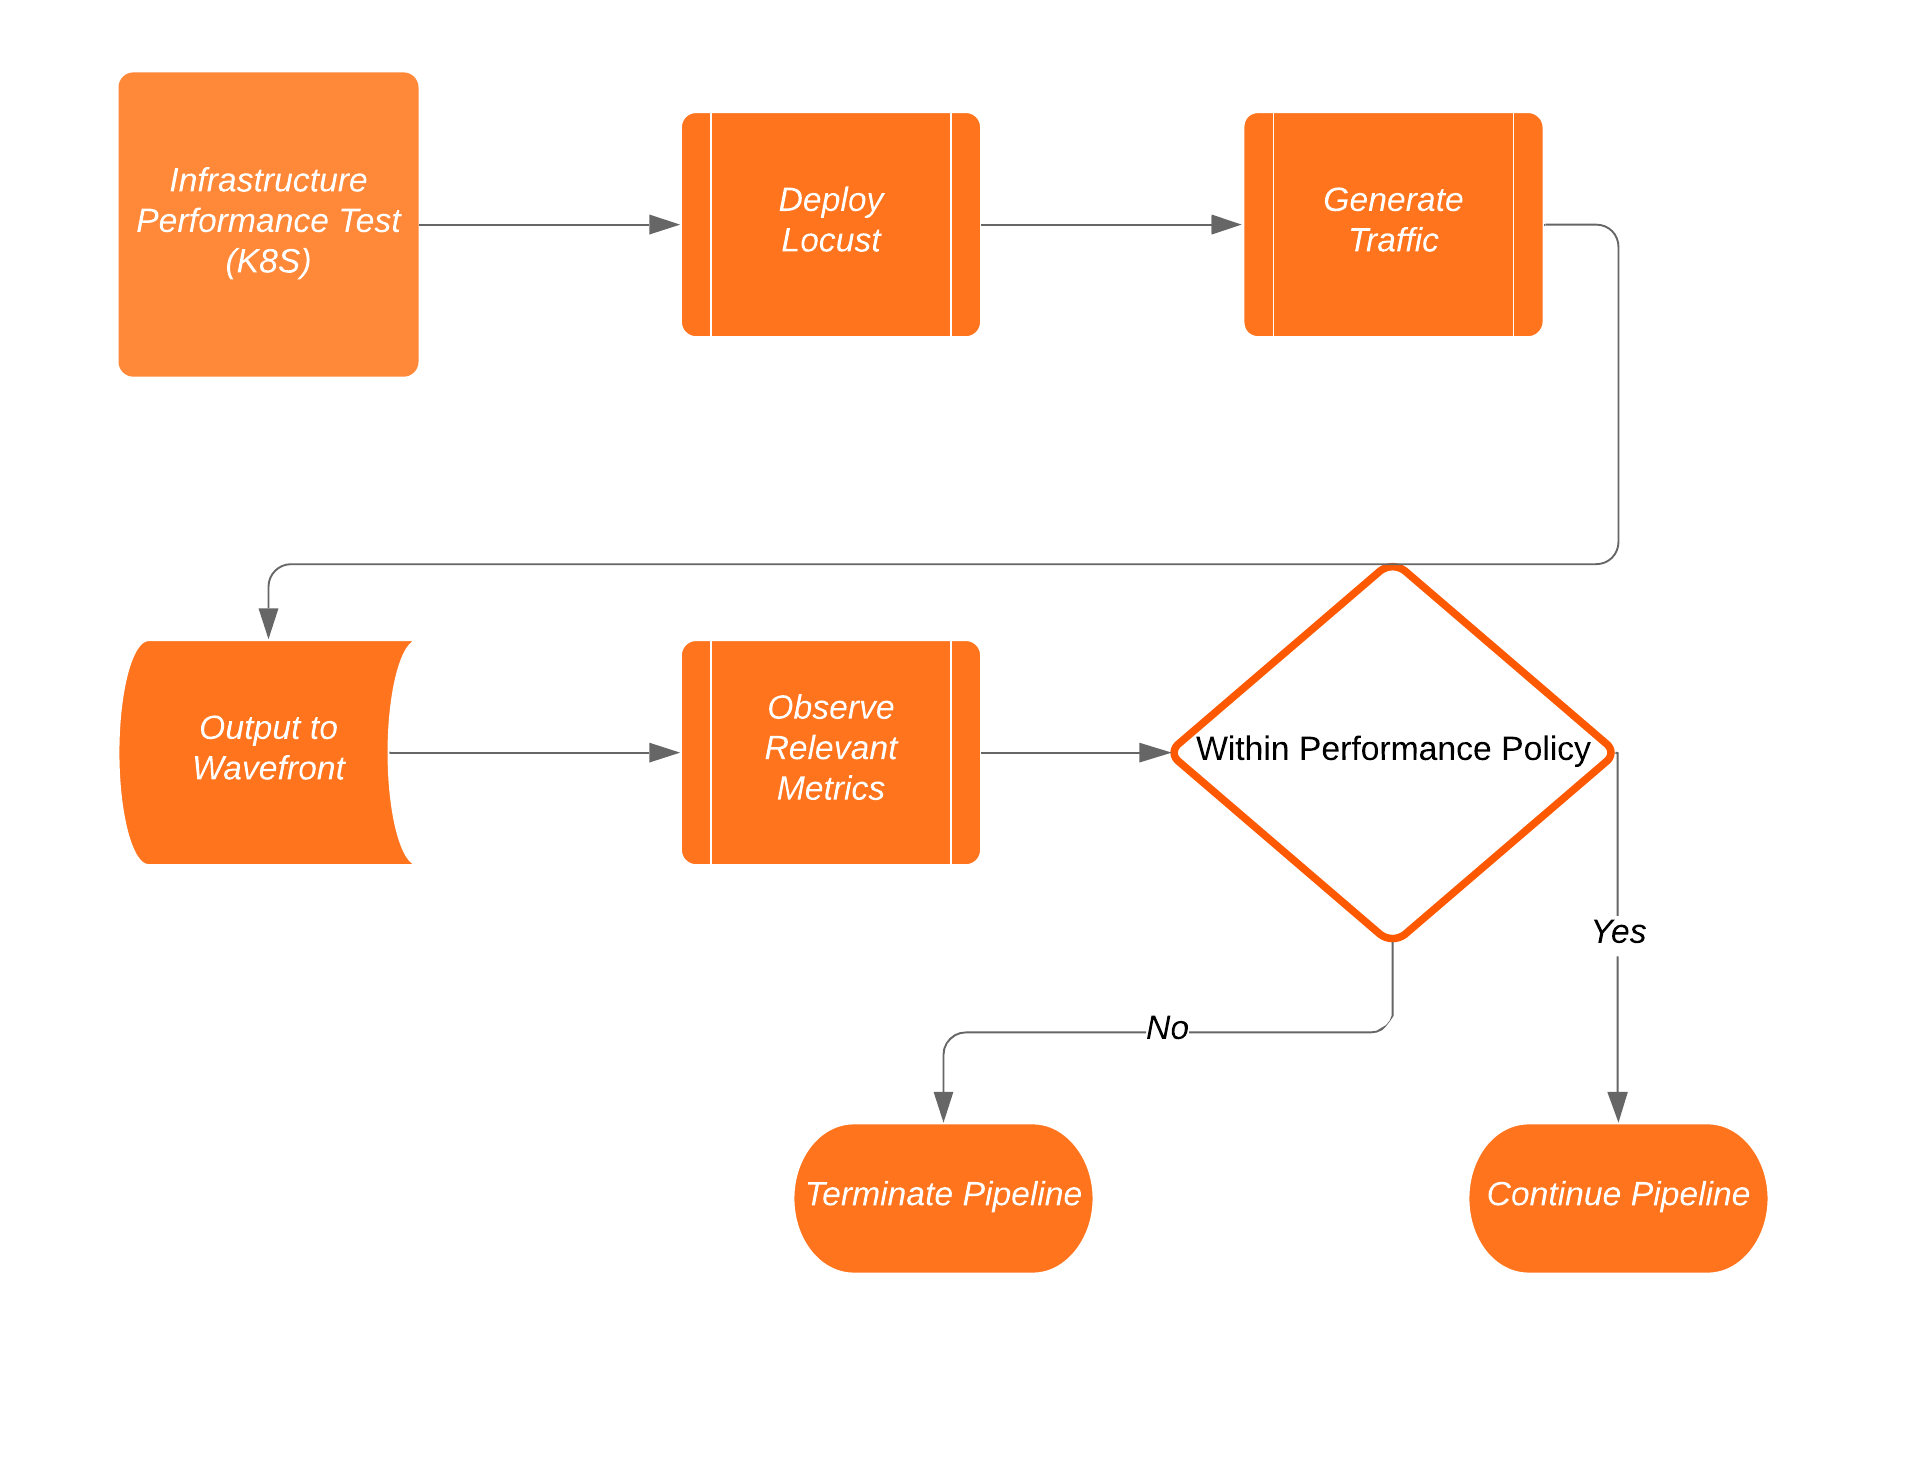
The graphic below details the 3 stages associated with this portion of a much larger pipeline.

FROM bitnami/minideb:stretch
LABEL maintainer "Bitnami <containers@bitnami.com>"

# Install required system packages and dependencies
RUN install_packages ca-certificates wget
RUN wget -nc -P /tmp/bitnami/pkg/cache/ https://downloads.bitnami.com/files/stacksmith/kubectl-1.12.10-1-linux-amd64-debian-9.tar.gz && \
    echo "57612b8cc7b8c93a708cd5f5314d824a153db26764aa7cbe80230ed6b32e7db0  /tmp/bitnami/pkg/cache/kubectl-1.12.10-1-linux-amd64-debian-9.tar.gz" | sha256sum -c - && \
    tar -zxf /tmp/bitnami/pkg/cache/kubectl-1.12.10-1-linux-amd64-debian-9.tar.gz -P --transform 's|^[^/]*/files|/opt/bitnami|' --wildcards '*/files' && \
    rm -rf /tmp/bitnami/pkg/cache/kubectl-1.12.10-1-linux-amd64-debian-9.tar.gz

RUN chmod +x /opt/bitnami/kubectl/bin/kubectl
ENV BITNAMI_APP_NAME="kubectl" \
    BITNAMI_IMAGE_VERSION="1.12.10-debian-9-r77" \
    PATH="/opt/bitnami/kubectl/bin:$PATH"

USER 1001
ENTRYPOINT [ "kubectl" ]
CMD [ "--help" ]
Traffic Generator
Traffic Generation or Load Testing in this example is provided by Locust. Locust is an open source load testing tool and the simulates http activity on you application. Locust is really simple to use and utilizes Python code to identify the parameters of the test you wish to run.
During the traffic Generation stage with Locust, the ‘traffic_gen.py’ file is run.
#!/usr/bin/env python
import logging
import subprocess
import sys
import os

# Run locust with parameters for load testing
def runLocust():
    frontend_target = os.environ["FRONTEND_TARGET"]
    host = "--host=http://"+ frontend_target
    result = subprocess.run(["locust", "-f", "/app/locustfile.py" , host , "--no-web", "-c 250", "-r 25", "--run-time=1m"], stdout=subprocess.PIPE)
    #print (result)

if __name__ == '__main__':
    logging.info("Running Locust \n")

    runLocust()
    sys.exit(0)
Notice the environment variable which happens to be the Frontend URL for application with the run parameters.
Parameters
- “–no-web” - Run locust without a UI
- “-c 250” - Number of users to spawn = 250
- “-r 25” - Hatch rate(number of users to spawn per second) = 25
- “–run-time=1m” - Run time of test = 1 minute
This will generate necessary traffic and lets Wavefront gather the associated metrics.
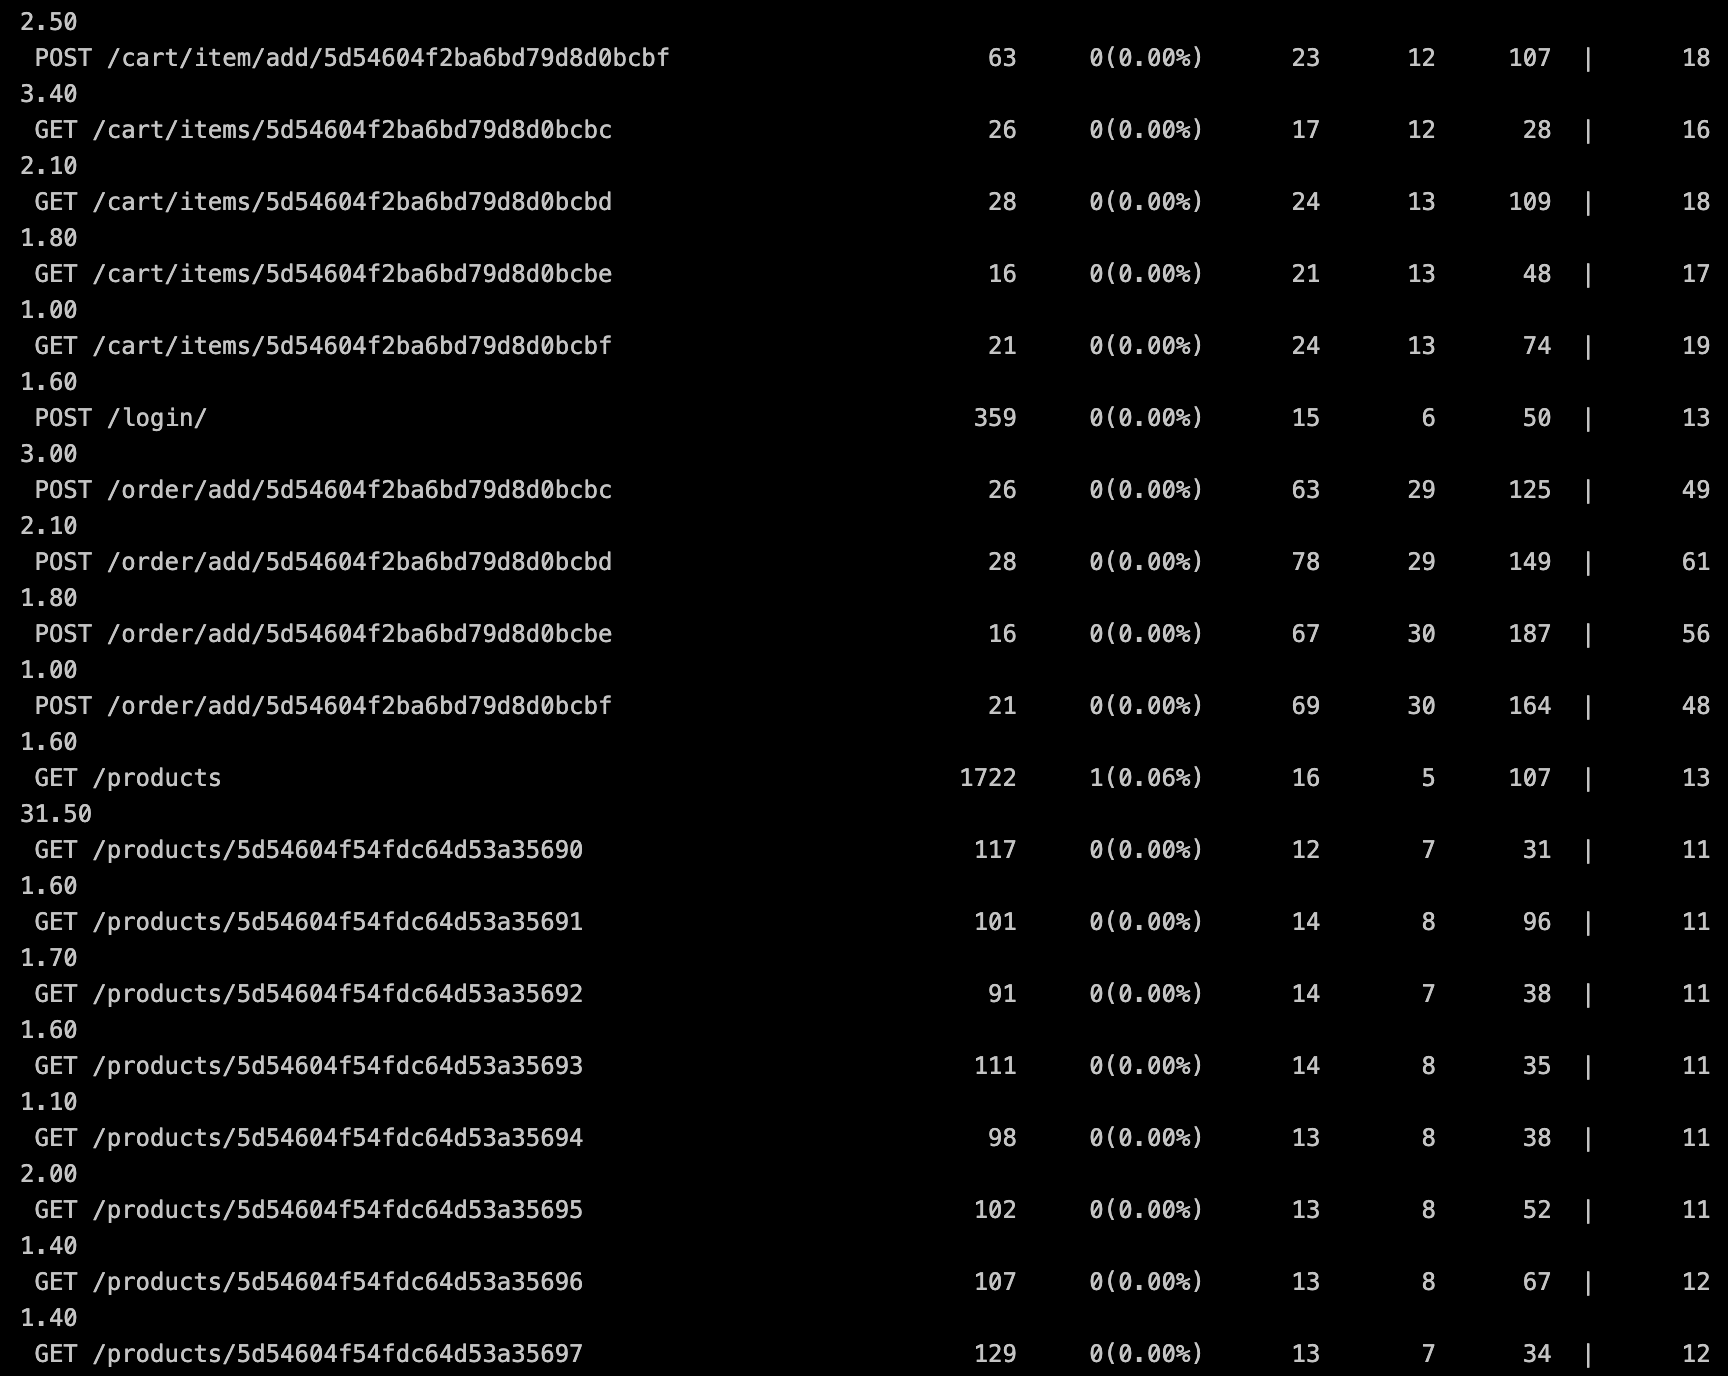
The following image shows Locust in action:
Wavefront Performance Check
The goal of this stage is to observe output from the previous stage and determine if the load test meet the requirements to continue the deployment or provisioning of the new cart service.
The kubernetes cluster used in this example already includes the necessary agents to gather the performance metrics generated in the previous step and ultimately output to Wavefront for this stage to proceed with validation. I am not going to detail the specifics of Wavefront Kubernetes integration but you can get more details here.
The Wavefront Pod Inspector is an app that uses the Wavefront API to get data on pods in a specific Kubernetes cluster. Using environment variables you can specify which metric and which pod should be looked at.
In this example, we are looking at the average of the ‘kubernetes.pod_container.cpu.usage_rate’ during the load generation test. With the Pod Inspector, you can specify the threadshold or metrics in which you find acceptable.
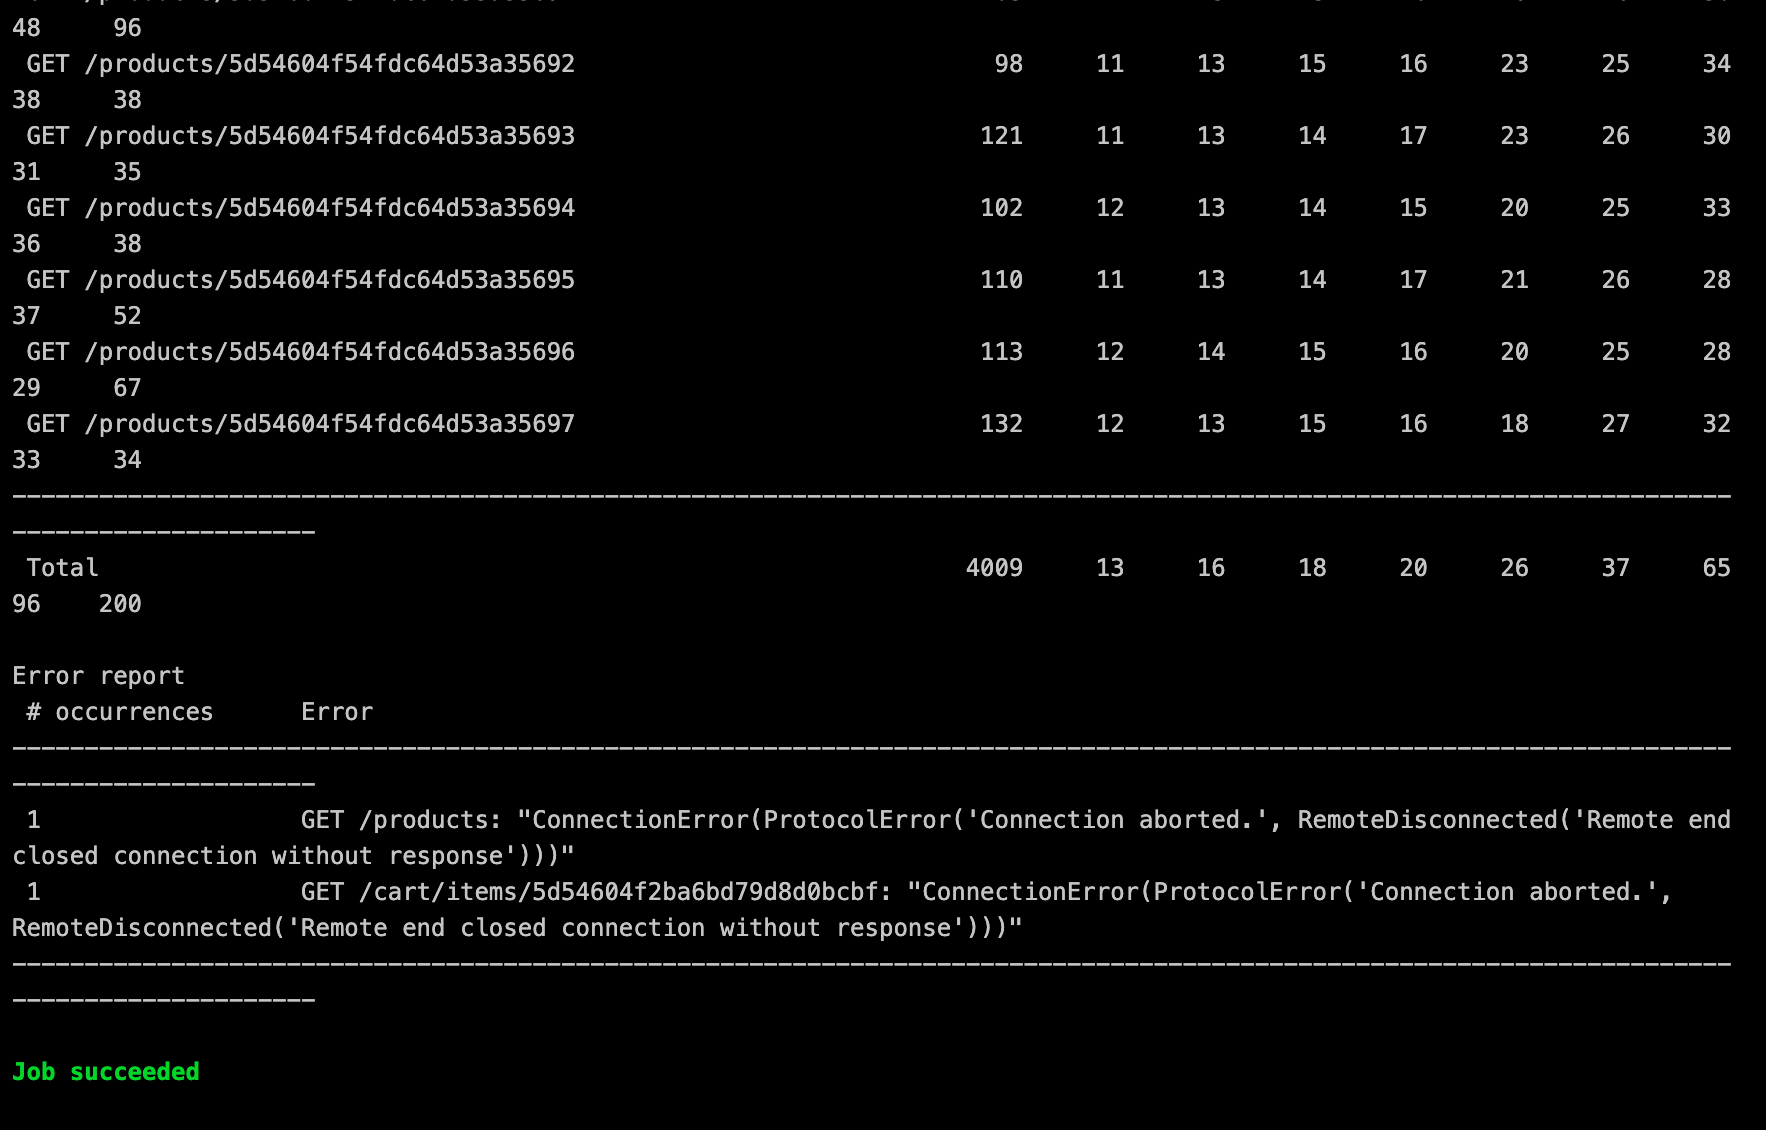
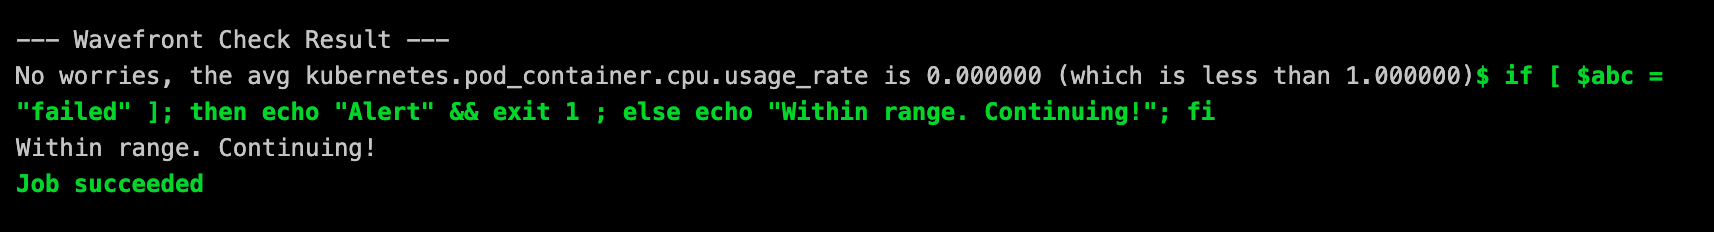
Below is image of the Job Success and complete output from the stage in Gitlab.
[0KRunning with gitlab-runner 12.1.0 (de7731dd)
[0;m[0K on My Docker Runner -z4CL5hX
[0;msection_start:1571242324:prepare_executor
[0K[0KUsing Docker executor with image retgits/wavefront-pod-inspector:latest ...
[0;m[0KPulling docker image retgits/wavefront-pod-inspector:latest ...
[0;m[0KUsing docker image sha256:f365311a20023105d3f89aa1d258469b059a37ad958e8a3595bca6796f08c55a for retgits/wavefront-pod-inspector:latest ...
[0;msection_end:1571242324:prepare_executor
[0Ksection_start:1571242324:prepare_script
[0KRunning on runner--z4CL5hX-project-13636938-concurrent-1 via gitlab-runner-vmworld2019...
section_end:1571242328:prepare_script
[0Ksection_start:1571242328:get_sources
[0K[32;1mFetching changes with git depth set to 50...[0;m
Reinitialized existing Git repository in /builds/vmware-cloud-advocacy/vmworld2019/.git/
[32;1mChecking out d679b1de as master...[0;m
Removing rawoutput.txt
[32;1mSkipping Git submodules setup[0;m
section_end:1571242334:get_sources
[0Ksection_start:1571242334:restore_cache
[0Ksection_end:1571242341:restore_cache
[0Ksection_start:1571242341:download_artifacts
[0Ksection_end:1571242347:download_artifacts
[0Ksection_start:1571242347:build_script
[0K[32;1m$ export GITLAB_TOKEN=$LEON_TOKEN[0;m
[32;1m$ export API_TOKEN=$WFTOKEN[0;m
[32;1m$ export CI_PROJECT_NAME=$CI_PROJECT_NAME[0;m
[32;1m$ echo calling Wavefront to get $METRIC details for pod $POD_NAME[0;m
calling Wavefront to get details for pod
[32;1m$ /bin/entrypoint.sh[0;m
--- Configuration Settings ---
Wavefront Variable: abc
Metric : kubernetes.pod_container.cpu.usage_rate
Cluster : acmefitness-aks-02
Pod : *******************************
Threshold : 1.000000
GitLab Project : vmworld2019
--- Calling Wavefront on ---
https://try.wavefront.com/api/v2/chart/api?cached=true&g=h&q=ts%28%22kubernetes.pod_container.cpu.usage_rate%22%2C+cluster%3D%22acmefitness-aks-02%22+and+pod_name%3D%22frontend-78b5998ddc-qr76x%22%29&s=1571238751461&sorted=false&strict=true
Wavefront response: 200 OK
--- Calling GitLab on ---
https://gitlab.com/api/v4/projects/vmware-cloud-advocacy%2fvmworld2019/variables/abc
Setting abc to passed
GitLab response: 200 OK
--- Wavefront Check Result ---
No worries, the avg kubernetes.pod_container.cpu.usage_rate is 0.678301 (which is less than 1.000000)[32;1m$ if [ $abc = "failed" ]; then echo "Alert" && exit 1 ; else echo "Within range. Continuing!"; fi[0;m
Within range. Continuing!
section_end:1571242354:build_script
[0Ksection_start:1571242354:after_script
[0Ksection_end:1571242356:after_script
[0Ksection_start:1571242356:archive_cache
[0Ksection_end:1571242358:archive_cache
[0Ksection_start:1571242358:upload_artifacts_on_success
[0Ksection_end:1571242361:upload_artifacts_on_success
[0K[32;1mJob succeeded
[0;m
Big thanks to Leon Stigter for his efforts on this stage.
You can access the repository and readme here
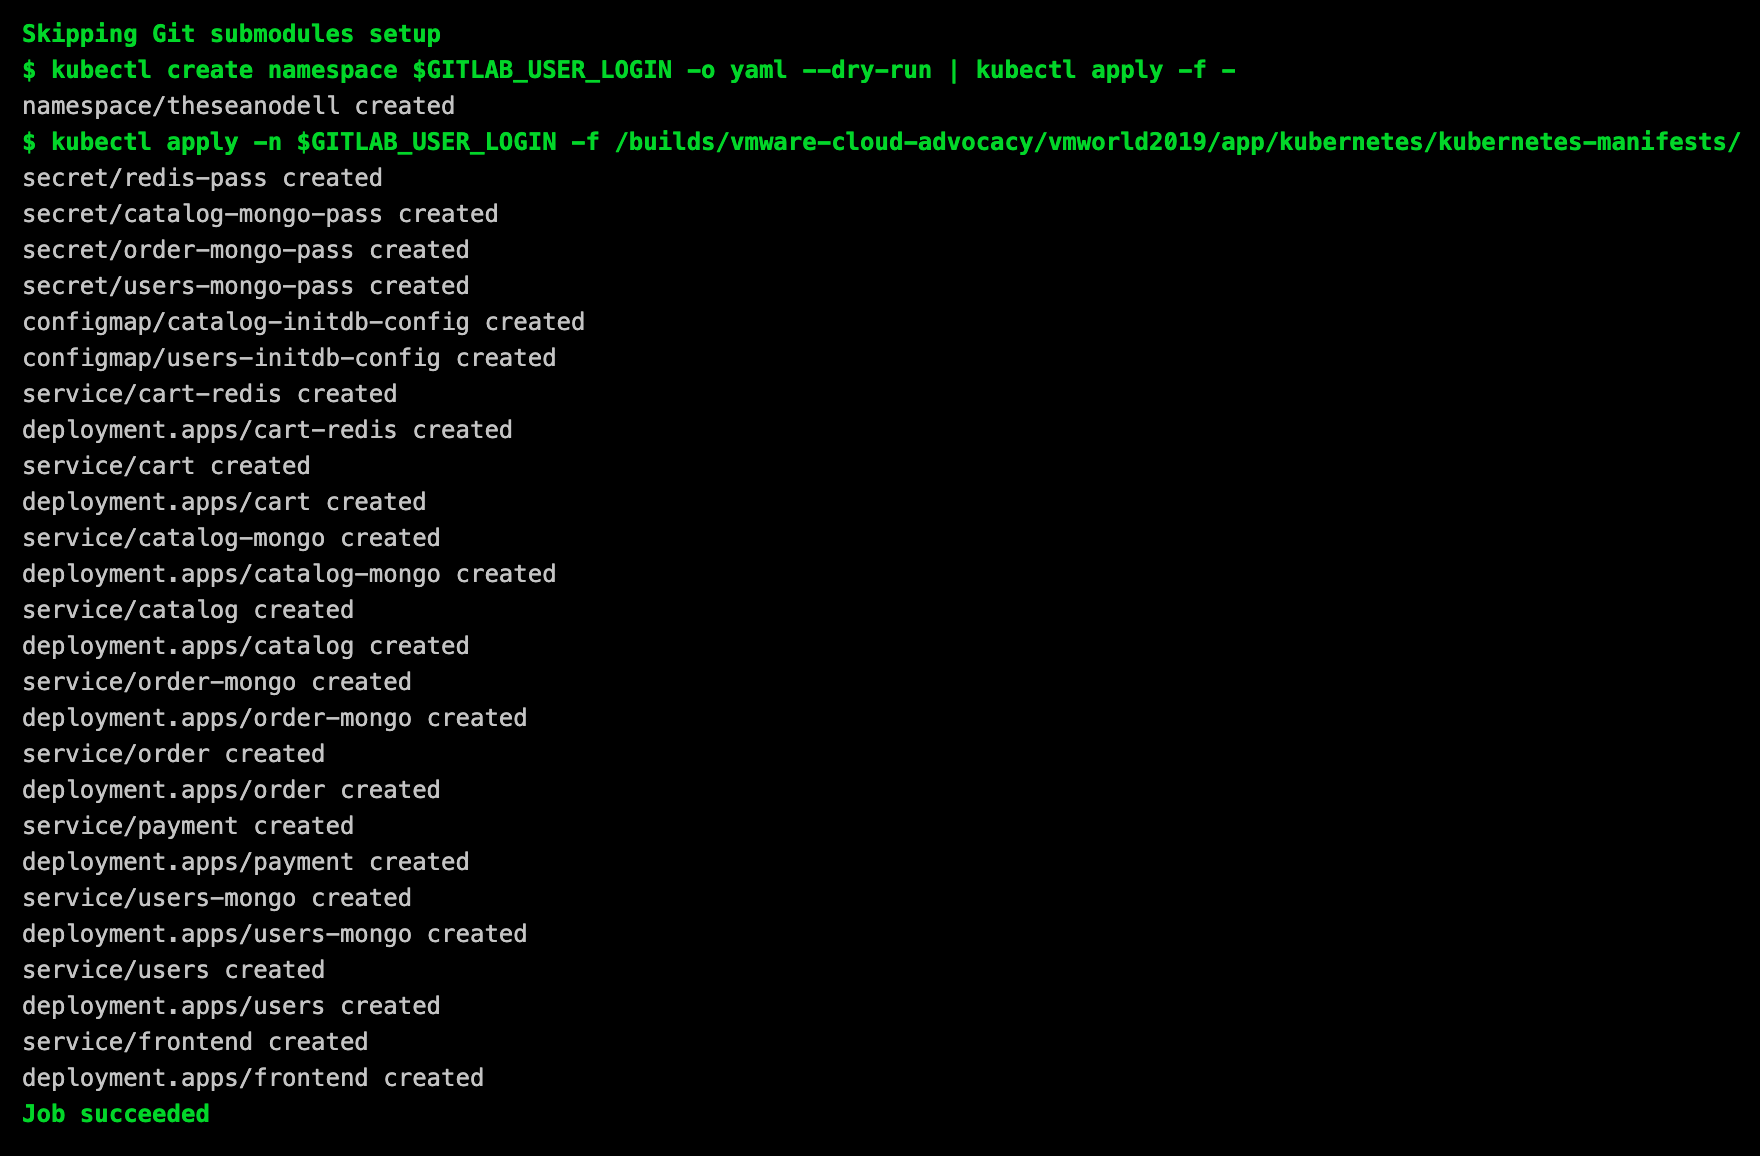
Production Deployment
The last stage in the process is the deployment of the updated services to the production Kubernetes Cluster. The following example is from the first time I deployed the entire Acme Fitness application to this Kubernetes environment.
[0KRunning with gitlab-runner 12.1.0 (de7731dd)
[0;m[0K on runner-gitlab-runner-767d89b7bb-nhqhz sRwv-ztB
[0;msection_start:1568835278:prepare_executor
[0K[0KUsing Kubernetes namespace: gitlab-managed-apps
[0;m[0KUsing Kubernetes executor with image bitnami/kubectl ...
[0;msection_end:1568835278:prepare_executor
[0Ksection_start:1568835278:prepare_script
[0KWaiting for pod gitlab-managed-apps/runner-srwv-ztb-project-13636938-concurrent-0wph4m to be running, status is Pending
Waiting for pod gitlab-managed-apps/runner-srwv-ztb-project-13636938-concurrent-0wph4m to be running, status is Pending
Waiting for pod gitlab-managed-apps/runner-srwv-ztb-project-13636938-concurrent-0wph4m to be running, status is Pending
Waiting for pod gitlab-managed-apps/runner-srwv-ztb-project-13636938-concurrent-0wph4m to be running, status is Pending
Waiting for pod gitlab-managed-apps/runner-srwv-ztb-project-13636938-concurrent-0wph4m to be running, status is Pending
Waiting for pod gitlab-managed-apps/runner-srwv-ztb-project-13636938-concurrent-0wph4m to be running, status is Pending
Waiting for pod gitlab-managed-apps/runner-srwv-ztb-project-13636938-concurrent-0wph4m to be running, status is Pending
Waiting for pod gitlab-managed-apps/runner-srwv-ztb-project-13636938-concurrent-0wph4m to be running, status is Pending
Waiting for pod gitlab-managed-apps/runner-srwv-ztb-project-13636938-concurrent-0wph4m to be running, status is Pending
Running on runner-srwv-ztb-project-13636938-concurrent-0wph4m via runner-gitlab-runner-767d89b7bb-nhqhz...
section_end:1568835306:prepare_script
[0Ksection_start:1568835306:get_sources
[0K[32;1mFetching changes with git depth set to 50...[0;m
Initialized empty Git repository in /builds/vmware-cloud-advocacy/vmworld2019/.git/
[32;1mCreated fresh repository.[0;m
From https://gitlab.com/vmware-cloud-advocacy/vmworld2019
* [new branch] master -> origin/master
[32;1mChecking out c75024f4 as master...[0;m
[32;1mSkipping Git submodules setup[0;m
section_end:1568835312:get_sources
[0Ksection_start:1568835312:restore_cache
[0Ksection_end:1568835313:restore_cache
[0Ksection_start:1568835313:download_artifacts
[0Ksection_end:1568835313:download_artifacts
[0Ksection_start:1568835313:build_script
[0K[32;1m$ kubectl create namespace $GITLAB_USER_LOGIN -o yaml --dry-run | kubectl apply -f -[0;m
namespace/theseanodell created
[32;1m$ kubectl apply -n $GITLAB_USER_LOGIN -f /builds/vmware-cloud-advocacy/vmworld2019/app/kubernetes/kubernetes-manifests/[0;m
secret/redis-pass created
secret/catalog-mongo-pass created
secret/order-mongo-pass created
secret/users-mongo-pass created
configmap/catalog-initdb-config created
configmap/users-initdb-config created
service/cart-redis created
deployment.apps/cart-redis created
service/cart created
deployment.apps/cart created
service/catalog-mongo created
deployment.apps/catalog-mongo created
service/catalog created
deployment.apps/catalog created
service/order-mongo created
deployment.apps/order-mongo created
service/order created
deployment.apps/order created
service/payment created
deployment.apps/payment created
service/users-mongo created
deployment.apps/users-mongo created
service/users created
deployment.apps/users created
service/frontend created
deployment.apps/frontend created
section_end:1568835318:build_script
[0Ksection_start:1568835318:after_script
[0Ksection_end:1568835324:after_script
[0Ksection_start:1568835324:archive_cache
[0Ksection_end:1568835324:archive_cache
[0Ksection_start:1568835324:upload_artifacts_on_success
[0Ksection_end:1568835326:upload_artifacts_on_success
[0K[32;1mJob succeeded
[0;m
Conclusion
Based upon the example provided above, we were able to generate load against an application to validate if the Kubernetes cluster meets the necessary requirements for the application. Thankfully the metrics were observed to be in range and therefore a success! If not, this blog would be a bit different and maybe we will look at the results of that scenario in the future.
Feel free to check out other blogs from the team on similar CI/CI topics and maybe you will come up with your own testing scenarios.
Summary Blog
Continuous Verification in Action
Cost Analysis
Being Budget Conscious in a Continuously Automated World
Security
Implementing a Continuous Security Model in the Public Cloud with Jenkins and Terraform : Part-1
Implementing a Continuous Security Model in the Public Cloud with Jenkins and Terraform: Part-2