
The Apperati authors been focused on developing the concept of Continuous Verification since we published our first post on it in July. As we’ve discussed it people outside our immediate team, it became evident that a concrete example of these concepts would help to clarify these concepts. As a result, we built a pipeline to demonstrate these ideas. The pipeline was built with the cooperation of our partner GitLab on top of their SaaS offering.
This pipeline is based around the ACME Fitness Shop microservice based application developed by our team. We’ll go stage by stage through this pipeline and explain what is happening in each job along the way.
As a reference, here is a graphical depiction of the pipeline broken into stages and jobs:
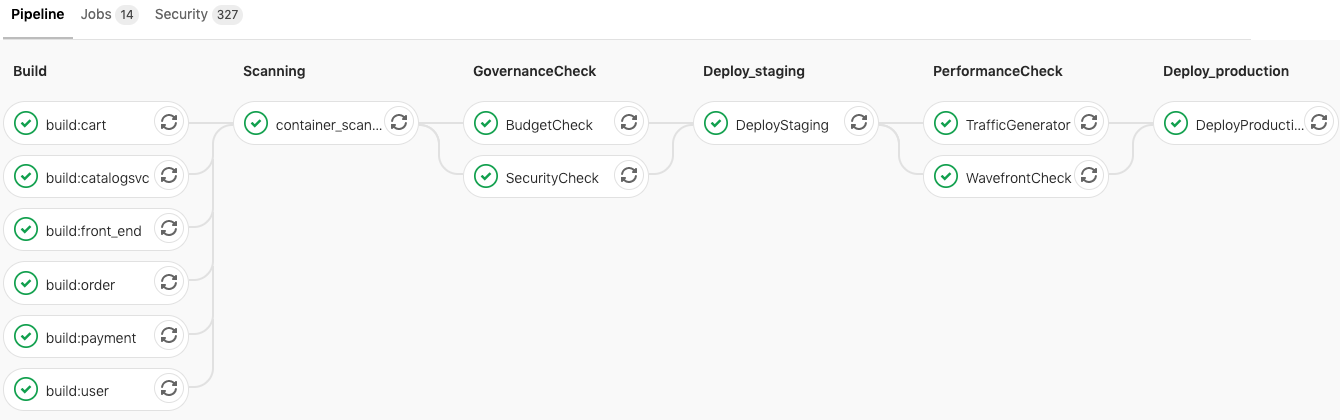
This pipeline and description are intended to illustrate the concept of Continuous Verification, not as a prescriptive recipe. Additional stages may be necessary when other applications are considered, and the ones depicted here may not be relevant in all cases. Similarly, other tools may be more appropriate in different circumstances. We hope you will adapt these themes to fit use cases as they arise.
Build Stage
The build stage of our example pipeline consists of six jobs (or tasks) executed in parallel. This is possible because our ACME Fitness Shop application consists of independent microservices, and effectively reduces the total execution time of the pipeline.
Each of these jobs builds a different docker image from the underlying application code stored in the project’s git repository. Because these jobs are functionally identical, let’s examine one (which builds the cart service) as an example to understand what is occurring across the build stage as a whole.
build:cart:
  stage: build
  image: docker:latest
  variables:
    DOCKER_HOST: tcp://docker:2375/
    DOCKER_DRIVER: overlay2
  services:
    - docker:dind
  before_script:
    - docker info
    - docker login registry.gitlab.com -u "$REGISTRY_USER" -p "$REGISTRY_PASSWORD"
  script:
    - docker info
    - docker build --file /builds/vmware-cloud-advocacy/vmworld2019/app/cart/Dockerfile -t gitlab-cart .
    - docker tag gitlab-cart registry.gitlab.com/vmware-cloud-advocacy/vmworld2019/gitlab-cart:latest
    - docker push registry.gitlab.com/vmware-cloud-advocacy/vmworld2019/gitlab-cart:latest
  tags:
    - Dedicated
  only:
    changes:
        - app/cart/**/*
In this example, there are several parameters which set the execution environment for the job which builds the cart service container image:
- build:cart: denotes the stage and job name of the task.
- The image: line specifies the Docker container image that will be used to execute the job.
- The Dedicated value in the tag: field is a selector which causes the job to be executed on a specific GitLab Runner
- The only: and changes: parameters define the conditions under which the above job will be triggered. This configuration will trigger the build:cart: job on any commit to the files of subfolders of app/cart/
Now that we’ve examined the parameters that the GitLab runner will use to execute this job, let’s look the execution of the job.
The active component of a GitLab job is specified by the script: keyword. The lines which follow it specify the shell script command(s) which the runner will execute. For this particular job, the script section consists of four commands to the docker process. These commands get information about the docker installation, build a docker image using the Dockerfile and code for the cart service, tag that image, and finally push the newly created image into the GitLab container registry associated with this project.
GitLab also provides the ability to specify commands that will execute either before or after the main script: block. These specialized script sections are referenced by the before_script and after_script: keywords. Looking at our example above, we have a before_script: section present. The commands in this section get information about the docker environment and authenticate the runner to the GitLab container registry to enable the docker push command which will follow during the script: section. There is no after_script: for this job.
The above description represents a single job which builds and pushes the docker image related to the cart service. In the Build stage, there are five additional jobs which build the docker containers for the front_end, catalog, payment, order, and user services respectively. These jobs may be executed in parallel and on different runners, provided the runner can meet the requirements listed in the job parameters.
Once the required container images have been built, the pipeline will move on to the container scanning stage.
Container Scanning Stage
The next stage of our pipeline is a direct response to the six job Build stage discussed in the previous section. The Scanning stage is a very specific type within GitLab which relies on two open source components, Clair and klar. Clair is an open source project which performs static analysis of vulnerabilities in application containers, while klar acts as a client which coordinates image checks between Clair and a (public or private) Docker registry.
Scanning is a predefined stage type within Gitlab, so the configuration within this pipeline is extremely simple. Here is the complete entry in our pipeline configuration:
container_scanning:
  stage: scanning
While the configuration of this single job stage is very simple, its outputs are important for a healthy and durable pipeline. The outputs from the Clair scan mentioned above are available via the console output of the container_scanning: job. A segment of the output for the Cart service is reproduced below:
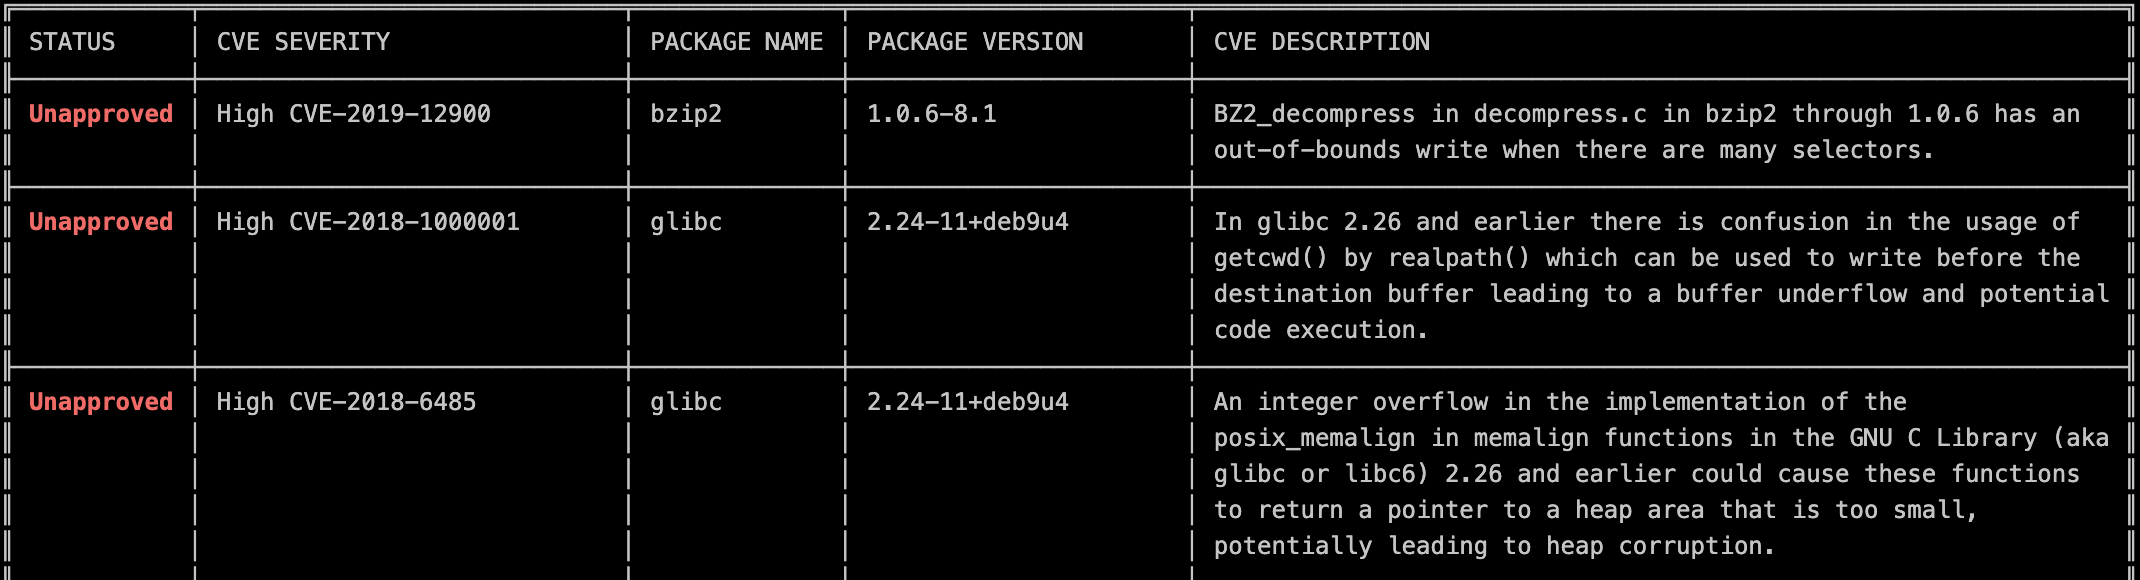
The full output of the scan is much more expansive, and is also written to a report in JSON format. This output is also collected for display in GitLab’s Security Dashboard if it is available in your instance. The dashboard provides both summary output:
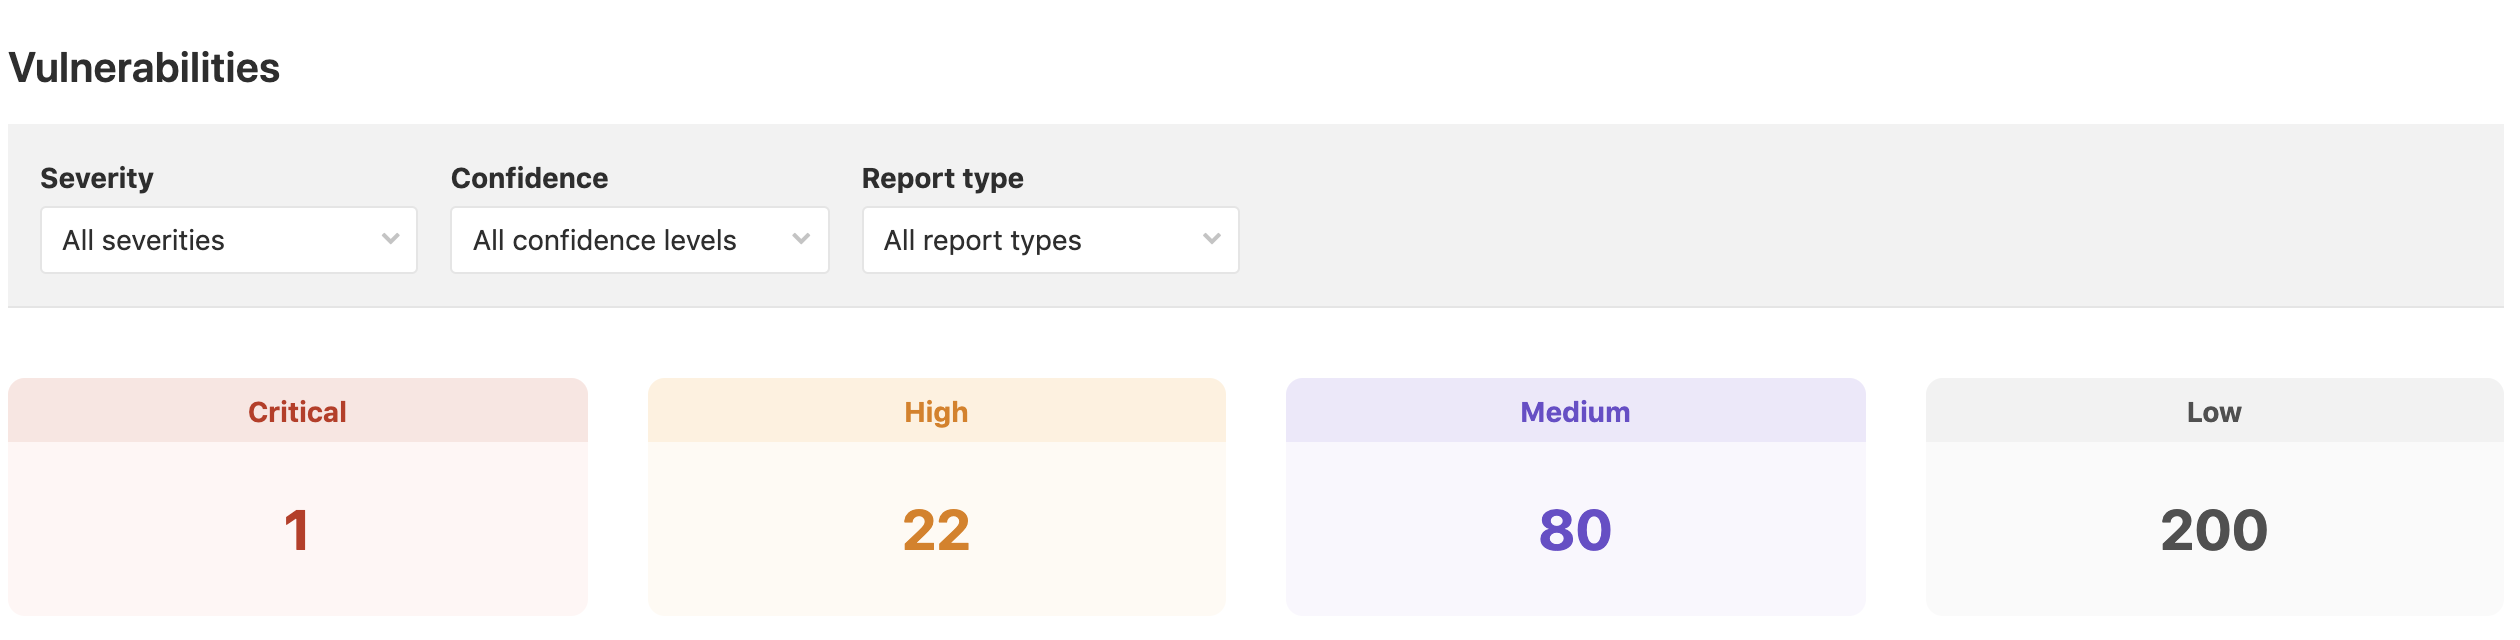
As well as detailed descriptions of individual Common Vulnerabilities and Exposures (CVEs):
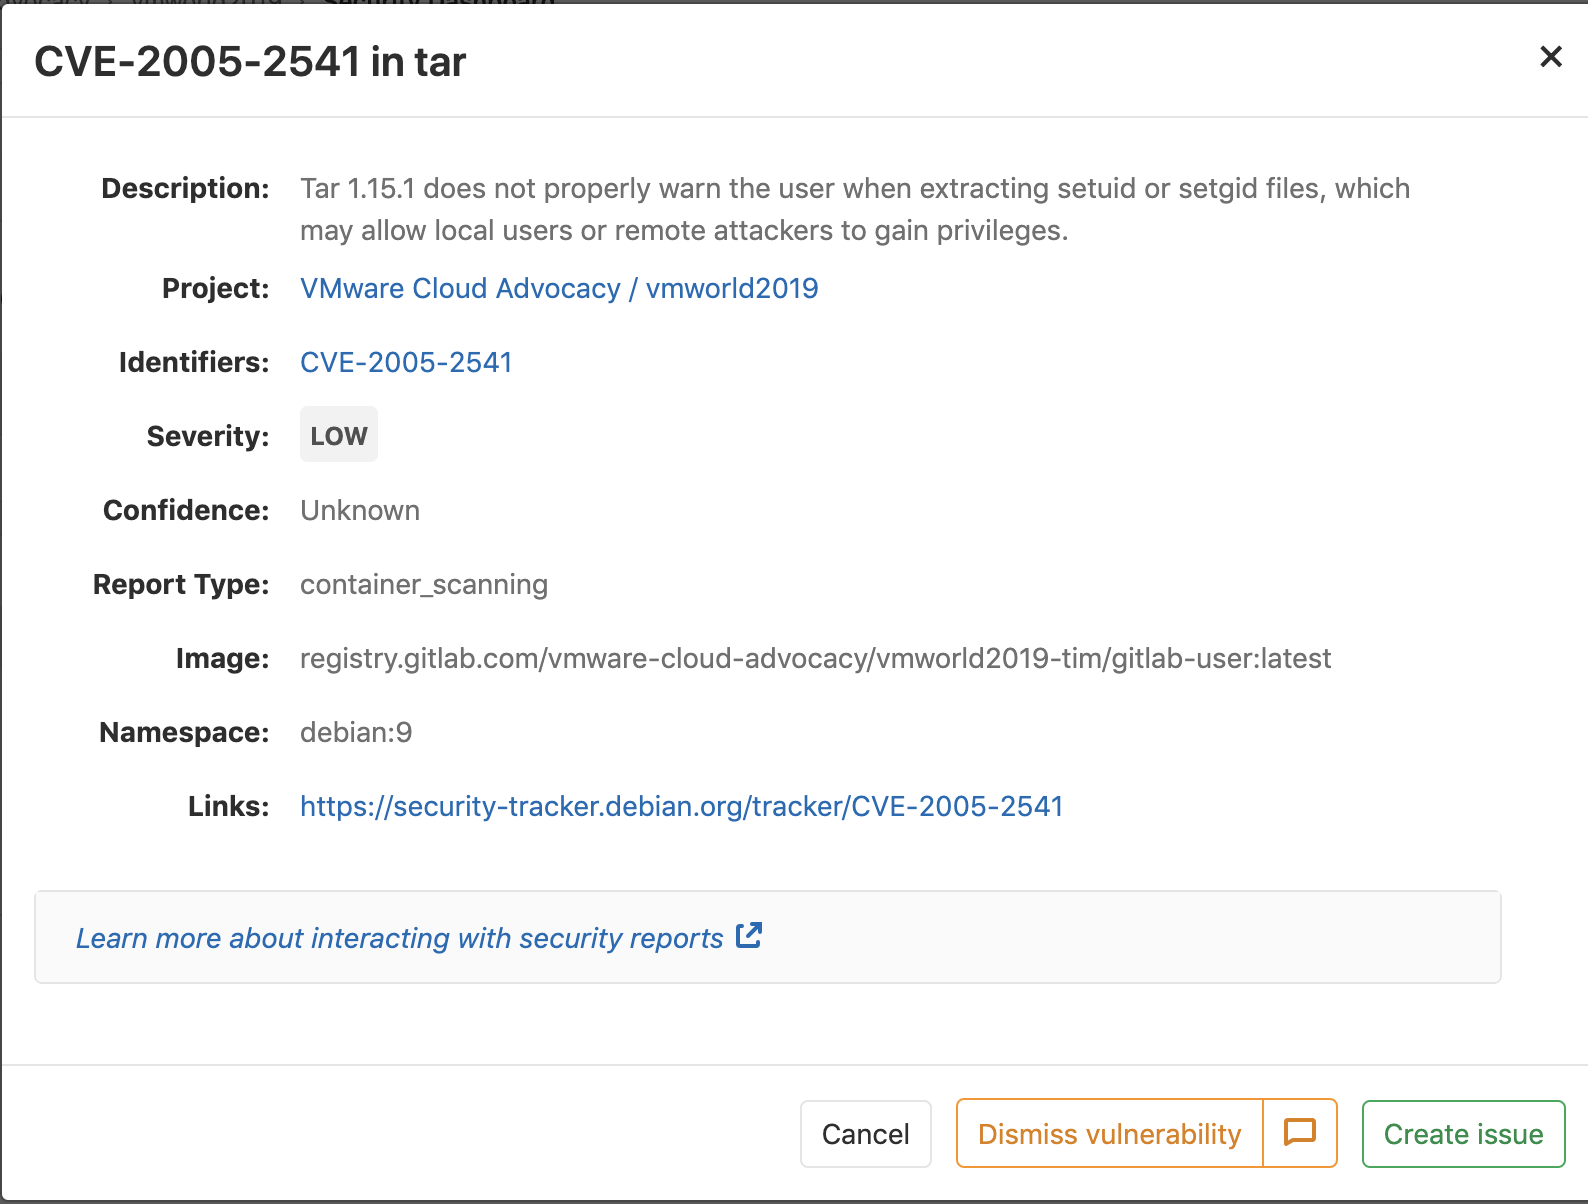
In this example, the container scanning output is collected to be displayed and used as a reference. In another pipeline, it could also be used as a trigger for additional action(s).
Once the container images have been scanned for vulnerabilities, the pipeline proceeds to verify that the staging environment is properly prepared for our application.
Governance Checks
The first two stages of this pipeline are typical of Continuous Integration (CI) tasks for microservice based applications. This stage contains the first tasks which are examples of Continuous Verification.
The Governance Checks stage consists of two jobs, a budget check and an environmental security check. In this pipeline, we’ve used CloudHealth and Secure State by VMware to verify that the staging cluster is prepared for deployment. These jobs are executed in parallel as they are discrete tasks with no dependencies on one another.
Budget Verification with CloudHealth
For the budget check, our pipeline will need to compare our current cloud spend for the month against a defined budget value. To get the current cloud spend for this environment, we consult a report in CloudHealth. To understand the mechanics behind this step, let’s consult the job configuration:
BudgetCheck:
  stage: GovernanceCheck
  image: vtimd/alpine-python-kubectl
  script:
    - chmod +x gitlab-budget-test_py.py
    - ./gitlab-budget-test_py.py $BILL_TOKEN
    - if [ $OVERAGE = "OVER" ]; then exit 1 ; else echo "Within Budget. Continuing!"; fi
  tags:
    - Dedicated
Several of these configuration elements should look familiar after our examination of the Build stage earlier. To understand this job, let’s focus on two aspects, the image: and script: sections.
For this task, a customized container image has been used in order to ensure that necessary utilities are available. As is likely obvious from the name, this image contains packages for python and the kubectl utility.
As we examine the script: section, it’s apparent why python was required. The script grants execute “+x” permission to a python script and then executes that script with a single parameter. The $BILL_TOKEN value for the parameter is a reference to an environment variable defined at the pipeline level within GitLab. This token allows the container executing the script to communicate with our CloudHealth instance.
In the last line we see some logic. It’s a simple switch which is designed to exit the job in error if the variable $OVERAGE is set to “OVER”. As a failsafe, the pipeline begins each execution with the variable set to “OVER”, and it will only be set to “UNDER” (and allow the job to complete without error) if the python script verifies that our current monthly cloud spend is less than the defined budget value.
We decided to reuse this python script which was originally written for an earlier post. However, this same process could also be executed by making direct API calls to CloudHealth in the script: section. The methodology is flexible, but keep in mind there is logic to manage with either method.
Environment Verification with VMware Secure State
Before deploying the application to the staging environment, the pipeline also checks the configuration of the targeted cloud infrastructure for vulnerabilities. For this capability, we have chosen to lean on VMware Secure State. Secure State will examine the cloud account containing the staging and production Kubernetes clusters and examine the configuration of all of the objects the account contains. These configurations will then be compared against a set of rules to identify violations. Here is the configuration for this job:
SecurityCheck:
  stage: GovernanceCheck
  image: vtimd/alpine-python-kubectl
  script:
    - chmod +x vss-findings.py
    - python3 vss-findings.py
    - if [ $VSS_VIOLATION_FOUND = "False" ]; then exit 1 ; else echo "Violation Check Passed. Continuing!"; fi
  tags:
    - Dedicated
The definition for this stage is similar in structure to the budget check. The API interaction(s) with Secure State are wrapped by a python script and executed from within the same customized container image seen in the budget check job. This job is also gated by a simple boolean condition, in this case using the $VSS_VIOLATION_FOUND environment variable. As with the budgetary check, this job is designed to “fail by default”, meaning that the pipeline will only be permitted to continue if the python script finds the correct conditions to change the value of the variable.
If both of these jobs complete successfully, the pipeline will move on to deploy the application to the staging cluster.
Deploy to Staging
Now that the pipeline has verified the configuration of the staging cluster, it will proceed to deploy the application to the staging kubernetes cluster. This deployment stage consists of a single job which deploys a set of kubernetes manifest files stored in a git repository. Below is the configuration for the deployment stage:
DeployStaging:
  stage: deploy_staging
  environment:
    name: staging
  image:
    name: bitnami/kubectl
    entrypoint: [""]
  script:
    - kubectl create namespace $GITLAB_USER_LOGIN -o yaml --dry-run | kubectl apply -f -
    - kubectl apply -n $GITLAB_USER_LOGIN -f /builds/vmware-cloud-advocacy/vmworld2019/app/kubernetes/kubernetes-manifests/
  tags:
    - cluster
    - kubernetes
    - staging
The environment: and name: keywords describe the cluster the job will operate on (the aptly name “staging” cluster), which was previously onboarded to GitLab. The entries under tags: are needed to ensure that this job executes on the GitLab runner which was deployed to the staging cluster as part of the registration process. To communicate with the kubernetes cluster, we opted to use the kubectl container from the Bitnami community catalog.
The script section of this stage is fairly straightforward. The first line creates a kubernetes namespace based on the name of the currently logged in GitLab user. We did this so that all six members of the Apperati authors cloud simultaneously run demos during an event without colliding with each other. The command creates a kubernetes manifest for the namespace in YAML format and pipes that output into a kubectl apply command. This was done in order to prevent the pipeline from exiting the job early if a namespace with that name already exists. Normally, such a result would return an error and cause the job to fail.
The second line of the script deploys the kubernetes manifests in the specified folder to the staging kubernetes cluster. These manifests represent all of the microservices associated with the AMCE Shop application. The -n $GITLAB_USER_LOGIN argument in this command specifies that the configuration in these manifests be deployed to the kubernetes namespace created in the first command.
With the application deployed, the next phase of the pipeline will verify that it is behaving as expected.
Performance Checks
With the application deployed to the staging cluster, we can now examine its performance characteristics to be sure it is suitable for deployment to the production environment. To do so, this stage will perform two tasks; deploying a traffic generator and verifying performance metrics by using Wavefront.
Traffic Generator
The traffic generator used in this case is locust.io. Locust is a load testing framework which is written in python and accepts configuration in a python file as well. In order for metrics data to populate in Wavefront, traffic must flow through the application. In order to accomplish this for a brief period of time, this job pushes live traffic across multiple API commands into the application. Here is the job configuration:
TrafficGenerator:
  stage: PerformanceCheck
  image:
    name: gcr.io/vmwarecloudadvocacy/locust:latest
  script:
   - chmod +x /app/traffic_gen.py
   - python3 /app/traffic_gen.py
  tags:
   - Dedicated
Please note that this job uses a customized container which has been built with the python and locust packages installed. The script: section is simple, it gives execute permission to a python script (traffic_gen.py) and runs that script. The script contains the commands to execute locust based on a locustfile already present in the container image.
With traffic flowing through the application and the resulting metrics being sent to Wavefront, it’s now possible to verify the performance of our application.
Wavefront Check
Now that the traffic generator is running and metrics are flowing into Wavefront, we can validate that the application’s performance characteristics justify deploying the application to production. This job is also based around a custom container image which contains the required logic. Let’s look at the configuration:
WavefrontCheck:
  stage: PerformanceCheck
  environment:
    name: staging
  image:
    name: retgits/wavefront-pod-inspector:latest
    entrypoint: [""]
  script:
    - export GITLAB_TOKEN=$LEON_TOKEN
    - export API_TOKEN=$WFTOKEN
    - export CI_PROJECT_NAME=$CI_PROJECT_NAME
    - echo calling Wavefront to get $METRIC details for pod $POD_NAME
    - /bin/entrypoint.sh
    - if [ $abc = "failed" ]; then echo "Alert" && exit 1 ; else echo "Within range. Continuing!"; fi
  tags:
    - Dedicated
This job is executed against the staging cluster as specified under environment: and uses the customized container image retgits/wavefront-pod-inspector. The script: section, however, starts differently to the previous jobs in the pipeline. The first three commands sent environment variables in the running container through the export command. The values of the variables are based on existing variables within the pipeline, which are specified with a preceding ‘$’. This was done as the container requires certain variable names to function correctly. The pipeline has different names for these variables, so a mapping was needed to ensure correct operation.
After setting these variables, the entrypoint.sh shell script is executed on the container. The logic of this check is similar to our previous verification steps as it looks at a variable to determine if the job will exit with an error or complete successfully. In this case, that variable is the vaguely names $abc. As with previous examples, this variable is set in the failure condition at the beginning of the pipeline, and will only change values if the logic in the container instructs it to do so.
Since the logic of this task isn’t present in the job configuration, it seems only fair to share which metric is examined. The script within the container checks the current CPU load on the front_end microservice and validates that it is below a threshold.
Assuming the performance check completes successfully, the pipeline will advance to its final stage, deploying the application to production.
Deploy to Production
This is the easiest stage of the pipeline to explain, because it’s functionally identical to Deploy to Staging. The only difference is this stage is that the environment: keyword lists ‘production’ as the environment name rather than ‘staging’.
We hope this breakdown of our Continuous Verification demonstration shines additional light on the concept and how it fits into modern application development and deployment processes. This framework is intended to be a process of refinement in contract to Continuous Integration and Continuous delivery, which tend to focus on the creation of artifacts. The number, type, and configuration of the checks should evolve over time as applications and their operational processes do.
As always, we look forward to continuing this conversation. Please feel free to reach out to me or the team on twitter with questions or comments.