
In my previous blog, we discussed 3 different ways of aggregating and processing logs from multiple accounts within AWS. These methods were :
1. Cloudwatch Logs plus Lambda Method
2. Cloudwatch Logs plus AWS SQS (Simple Queue Service) Method
3. Cloudwatch Logs plus AWS Kinesis Method
After analyzing the pros and cons based on scenarios, we concluded that using Method #3 is ideal for most of the customers having more than 2 accounts.
In this blog, I will walk through step by step process for setting up Method #3 for aggregating logs.
Overview of Method #3 - Cloudwatch Logs plus AWS Kinesis
Before we start the setup, let’s take a quick look at the architecture for Method #3.
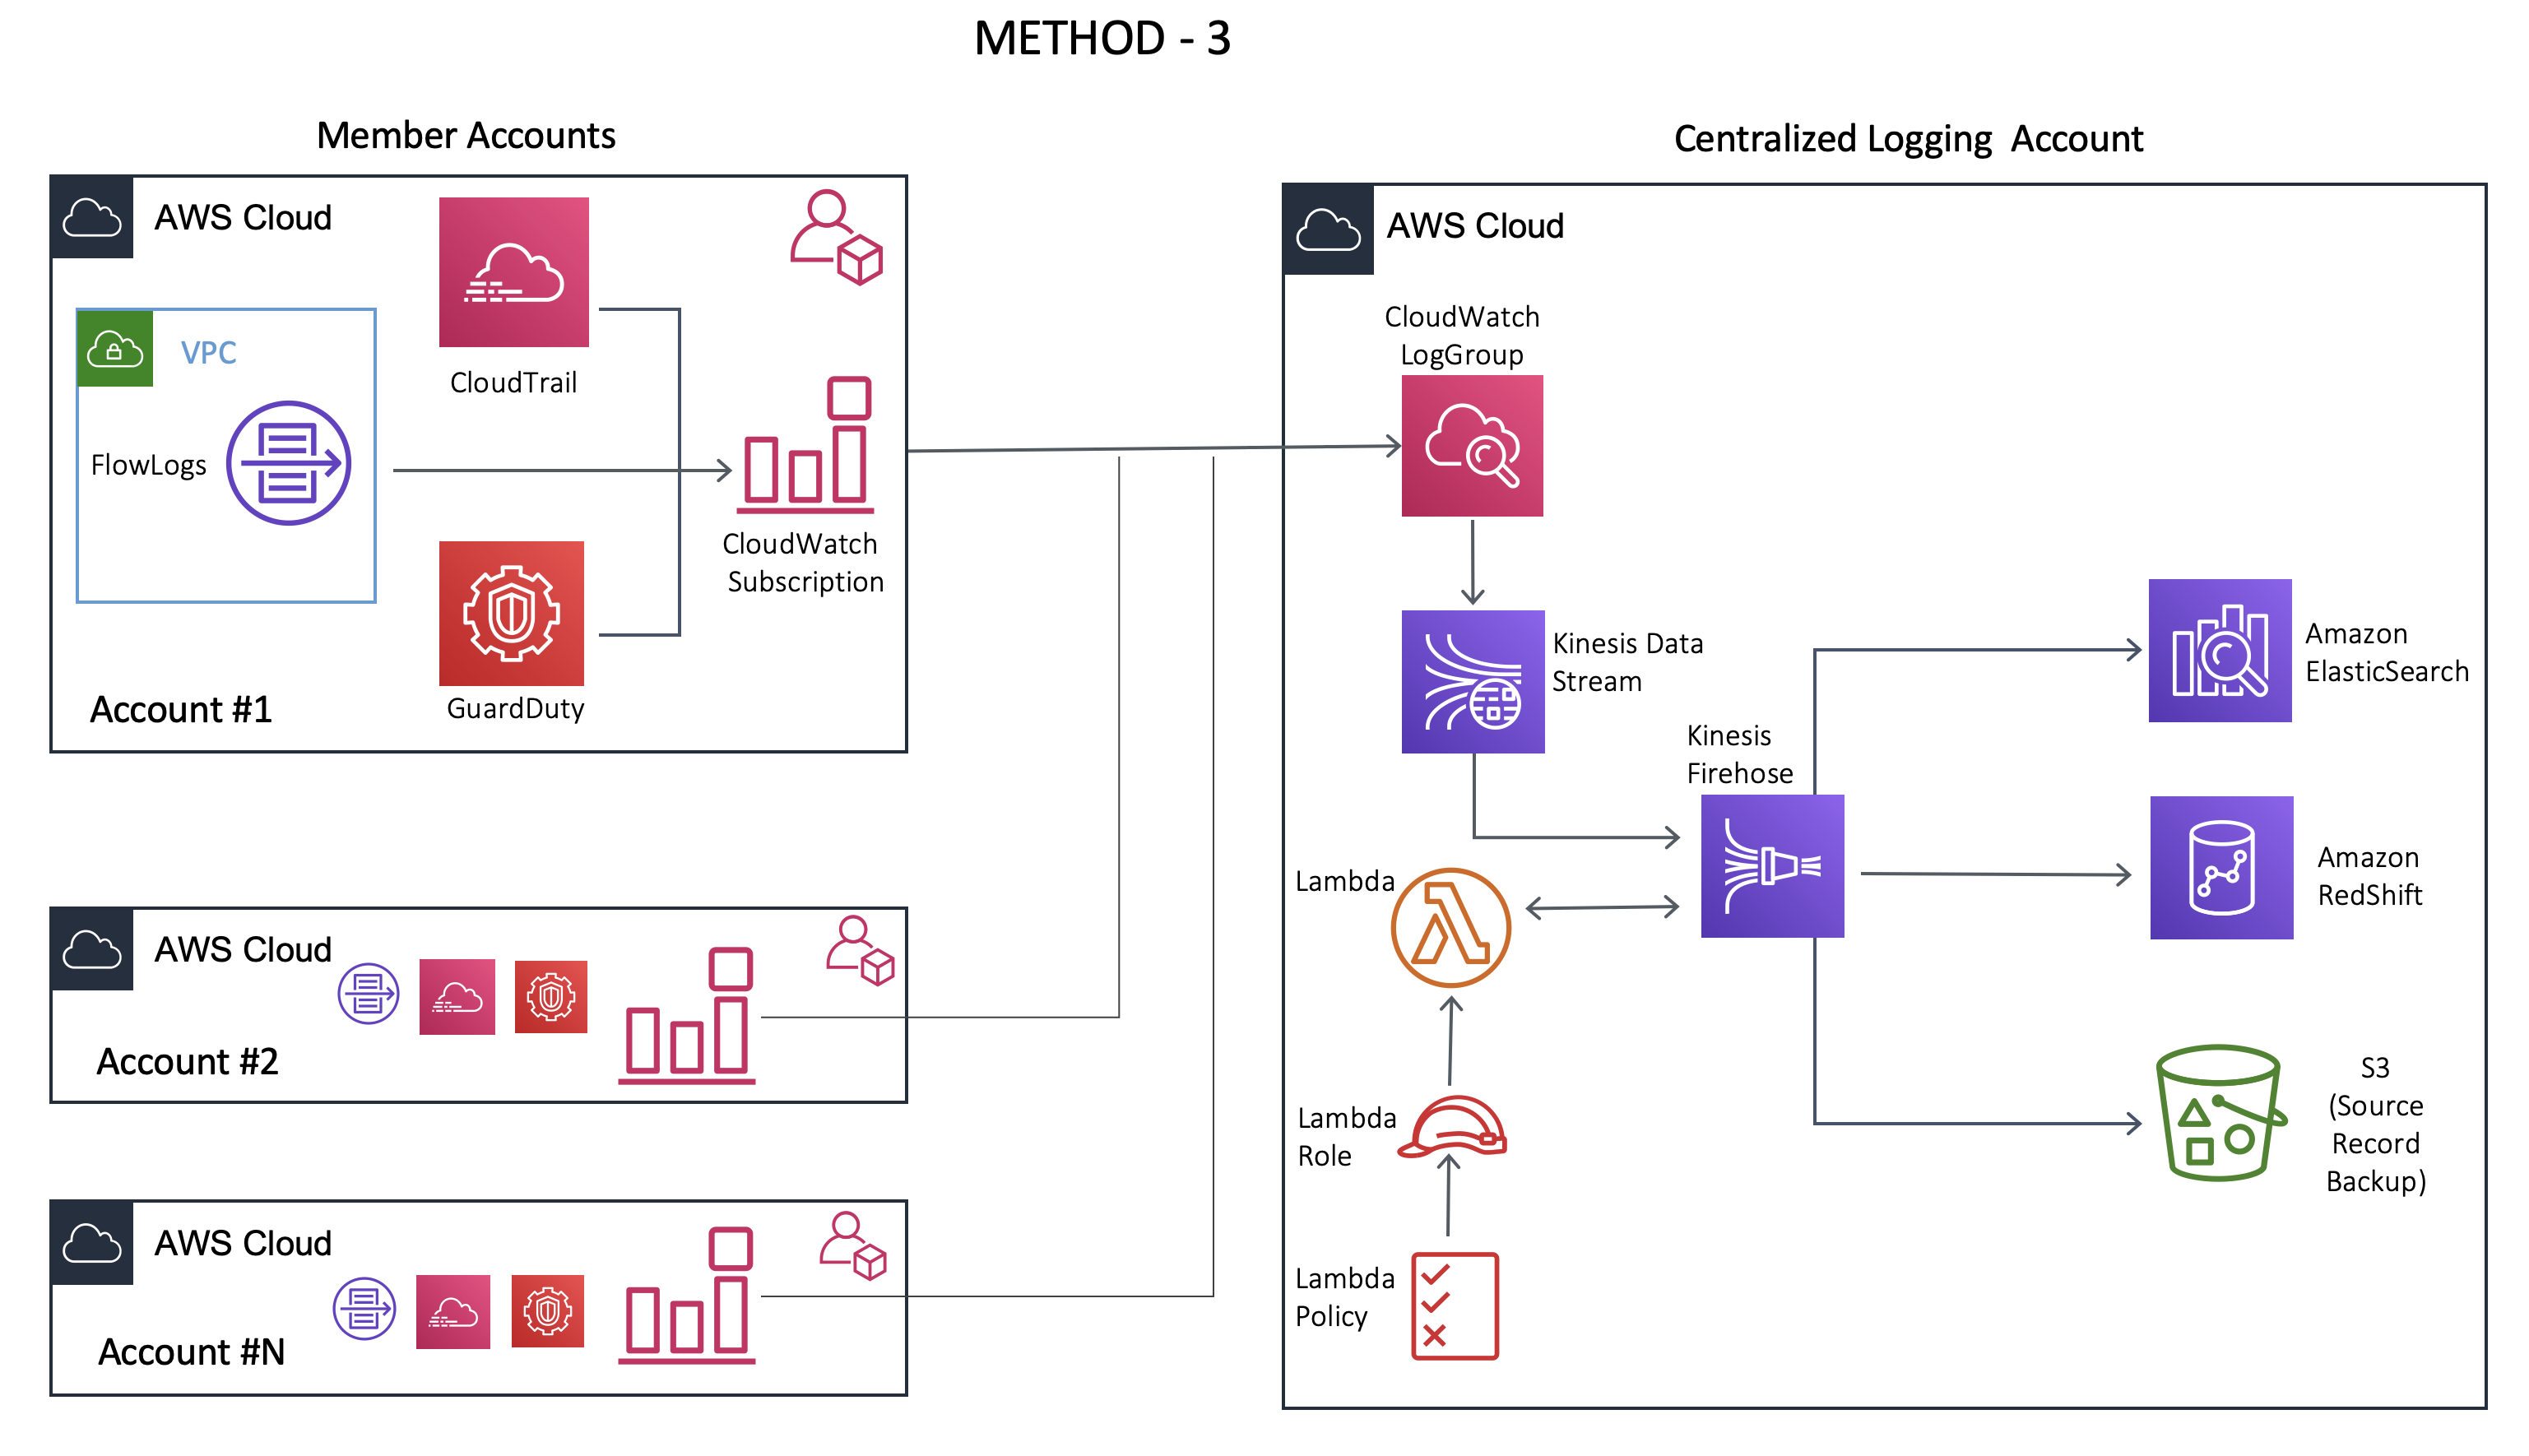
The following resources will be used during the setup:
- AWS VPC Flow Logs
- AWS CloudTrail
- AWS GuardDuty
- AWS CloudWatchLogs
- Amazon Kinesis Stream
- Amazon Kinesis Firehose
- AWS Lambda
- AWS S3 / RedShift
- Amazon ElasticSearch
Steps
Let’s now go through one step at a time. As I demonstrate these steps, I will be using a combination of AWS CLI and the AWS Web Console.
NOTE: Not all features can be configured from the AWS Web Console.
Initial Master Account Setup
Step 1: Create ElasticSearch Cluster (Master/Logging Account)
Refer to this article to setup your ElasticSearch cluster in the MASTER/CENTRALIZED LOGGING account.
Step 2: Create S3 buckets (Master/Logging Account)
Create two s3 buckets in the master account.
The first S3 bucket would be for collecting logs processed by Kinesis Firehose (described later) as well as logs that failed the log processing stage. I will call this bucket demo-logs-s3. DO NOT ATTACH any additional policy to this bucket.
The second S3 bucket would be for backing up/collecting all the cloud-trail logs from member accounts to the Master/Logging account. I will call this bucket cloudtrail-all-accounts-demo.
The cloudtrail-all-accounts-demo bucket needs a bucket policy that allows member accounts to write to this bucket.
{
  "Version": "2012-10-17",
  "Statement": [
    {
      "Sid": "AWSCloudTrailAclCheck20131101",
      "Effect": "Allow",
      "Principal": {
        "Service": "cloudtrail.amazonaws.com"
      },
      "Action": "s3:GetBucketAcl",
      "Resource": "arn:aws:s3:::cloudtrail-all-accounts-demo"
    },
    {
      "Sid": "AWSCloudTrailWrite20131101",
      "Effect": "Allow",
      "Principal": {
        "Service": "cloudtrail.amazonaws.com"
      },
      "Action": "s3:PutObject",
      "Resource": [
        "arn:aws:s3:::cloudtrail-all-accounts-demo/AWSLogs/MEMBER_ACCOUNT_ID_1/*",
        "arn:aws:s3:::cloudtrail-all-accounts-demo/AWSLogs/MEMBER_ACCOUNT_ID_2/*"
      ],
      "Condition": {
        "StringEquals": {
          "s3:x-amz-acl": "bucket-owner-full-control"
        }
      }
    }
  ]
}
Step 3: Setup Kinesis Data Stream (Master/Logging Account)
In the Master/Logging account, navigate to Services > Kinesis > Data Streams > Create Kinesis Stream .
The number of shards that you need to provision depends on the size of logs being ingested. There is an evaluation tool available on AWS that helps you with estimation.
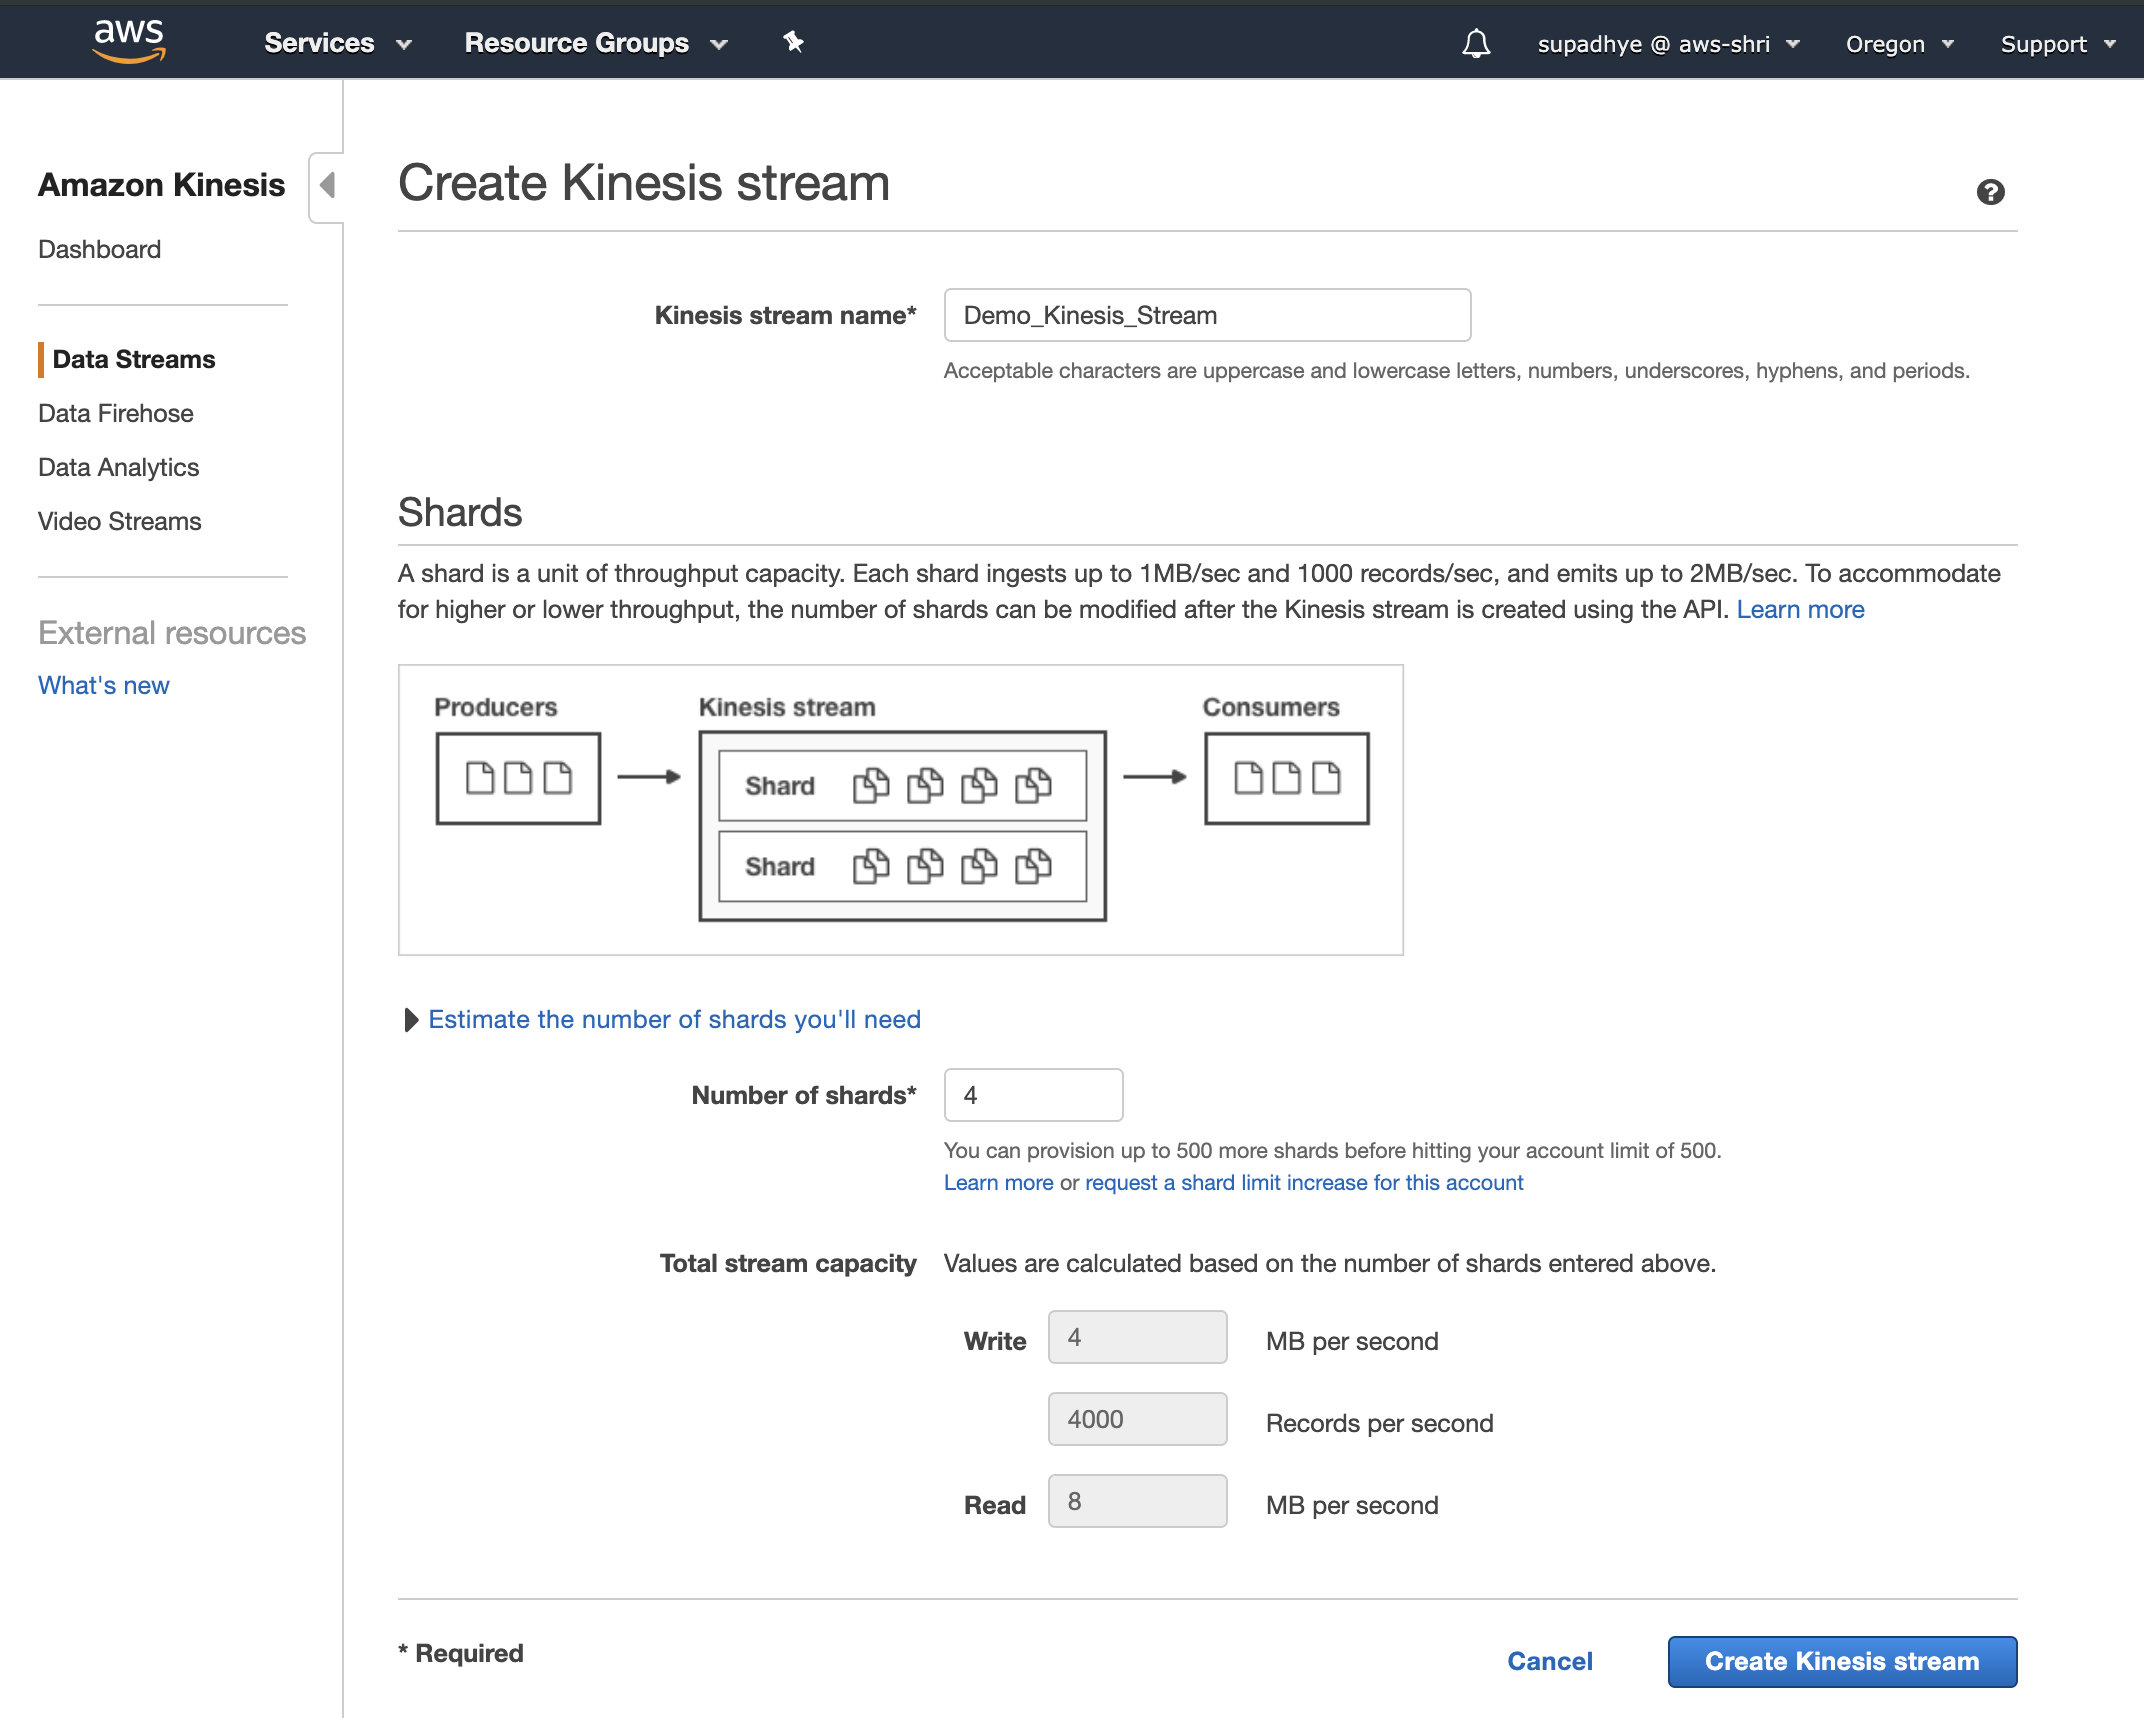
It’s always a best practice to modify the Data Retention Period for Kinesis Stream. The default retention period is 24 hours and the max can be 7 days. To modify this, you can edit the stream created above and update it.
To perform the same operation from CLI, run
aws kinesis create-stream --stream-name Demo_Kinesis_Stream --shard-count 4
Use this command to increase the retention period
aws kinesis increase-stream-retention-period --stream-name Demo_Kinesis_Stream --retention-period-hours 168
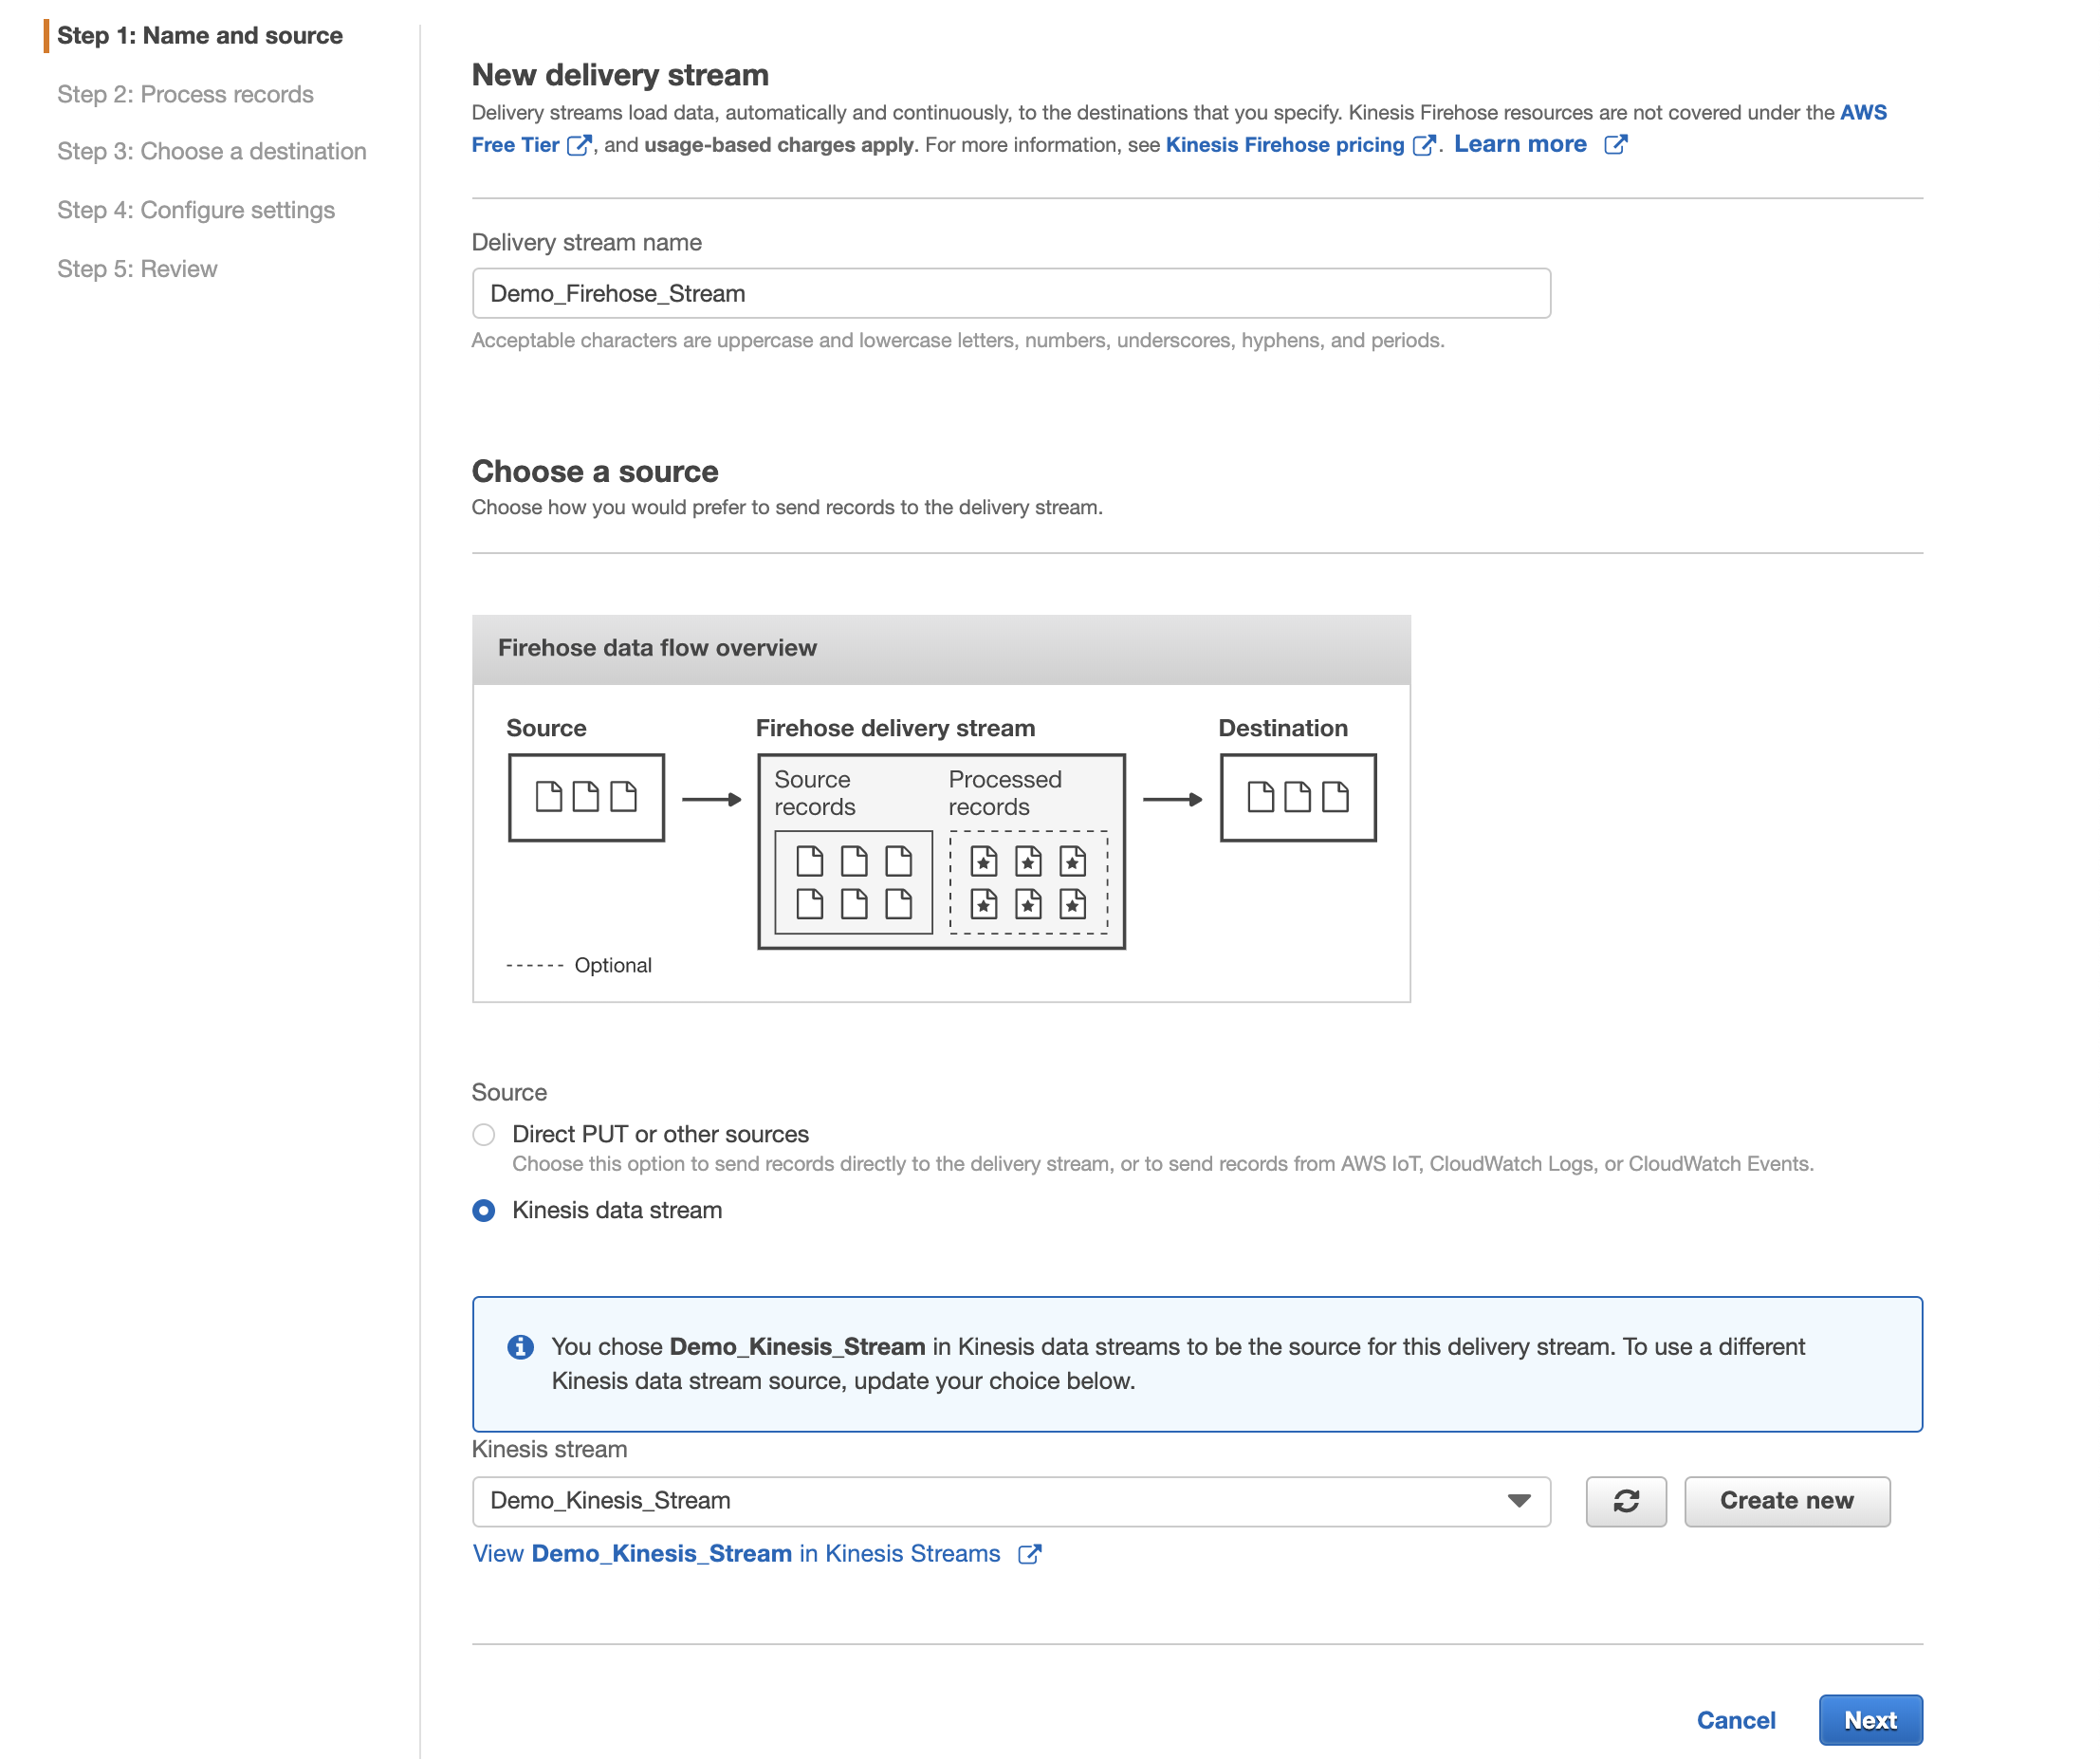
Step 4: Setup Kinesis Firehose (Master/Logging Account)
Select the Kinesis Data Stream created in Step 3 and click on Connect Kinesis Consumers > Connect Delivery Stream
Moving on to the Process records step, you can also set up a data transformation function that will parse the incoming logs to analyze only those which are important. Click on Enabled and choose a lambda function that will do this transformation.
NOTE: Kinesis Firehose expects a particular data format. Refer here for more info.
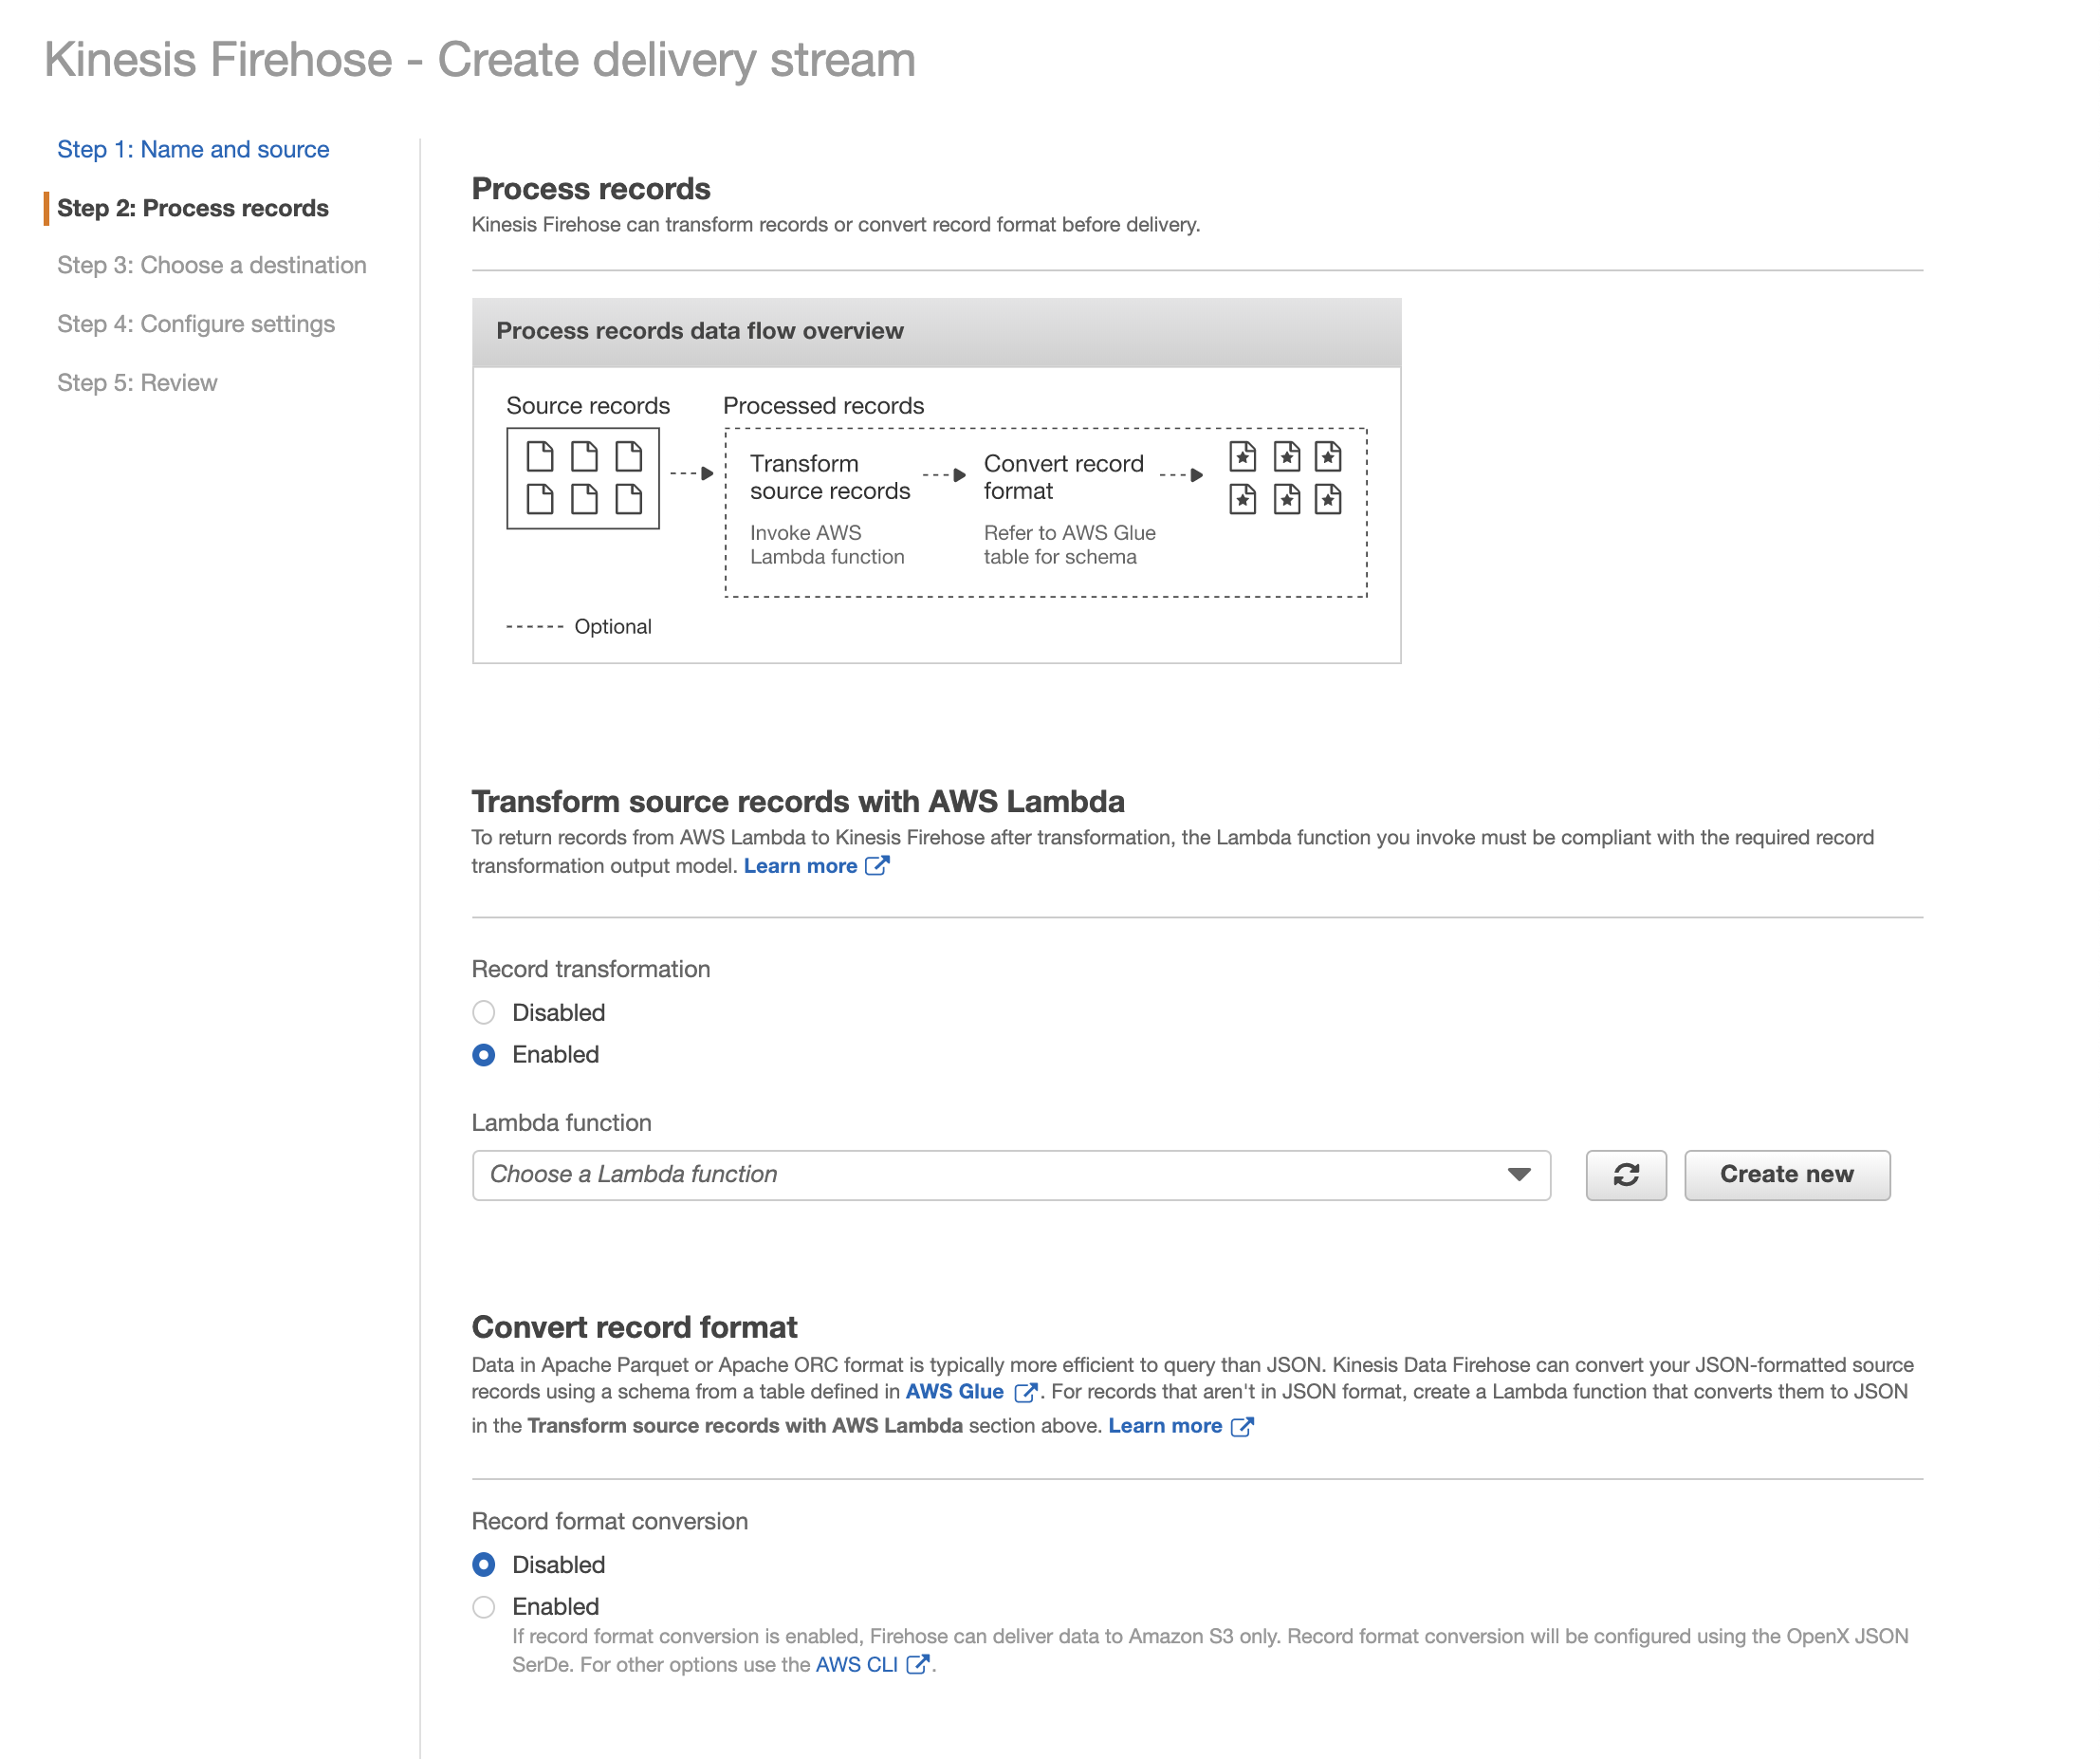
If you don’t have any existing lambda functions to do this then click on Create New and Select Kinesis Firehose Process Record Streams as source.
Change the Runtime for lambda to python 3.6 and Click Next
Use the code from this repository within your Lambda function.
import base64
import gzip
import io
import json
import zlib

def cloudwatch_handler(event, context):
    output = []

    for record in event['records']:
      compressed_payload = base64.b64decode(record['data'])
      uncompressed_payload = gzip.decompress(compressed_payload)
      print('uncompressed_payload',uncompressed_payload)
      payload = json.loads(uncompressed_payload)

      # Drop messages of type CONTROL_MESSAGE
      if payload.get('messageType') == 'CONTROL_MESSAGE':

          output_record = {
              'recordId': record['recordId'],
              'result': 'Dropped'
          }
          return {'records': output}


       # Do custom processing on the payload here
      output_record = {
          'recordId': record['recordId'],
          'result': 'Ok',
          'data': base64.b64encode(json.dumps(payload).encode('utf-8')).decode('utf-8')
      }
      output.append(output_record)

    print('Successfully processed {}        records.'.format(len(event['records'])))

    return {'records': output}
Also, modify the Timeout under Basic Settings as shown below.
Now, go back to the Kinesis Firehose setup page and select the lambda function. In this step, we won’t be converting the record format as we want to send logs to ElasticSearch and S3.
Next, we need to select a destination to send these processed logs to. In this example, I will be sending it to Amazon ElasticSearch Service.
From the drop-down select the elastic search cluster created in Step 1. Also, select the s3 bucket created in Step 2 to backup the logs for future use. This might be necessary for regulatory and compliance reasons.
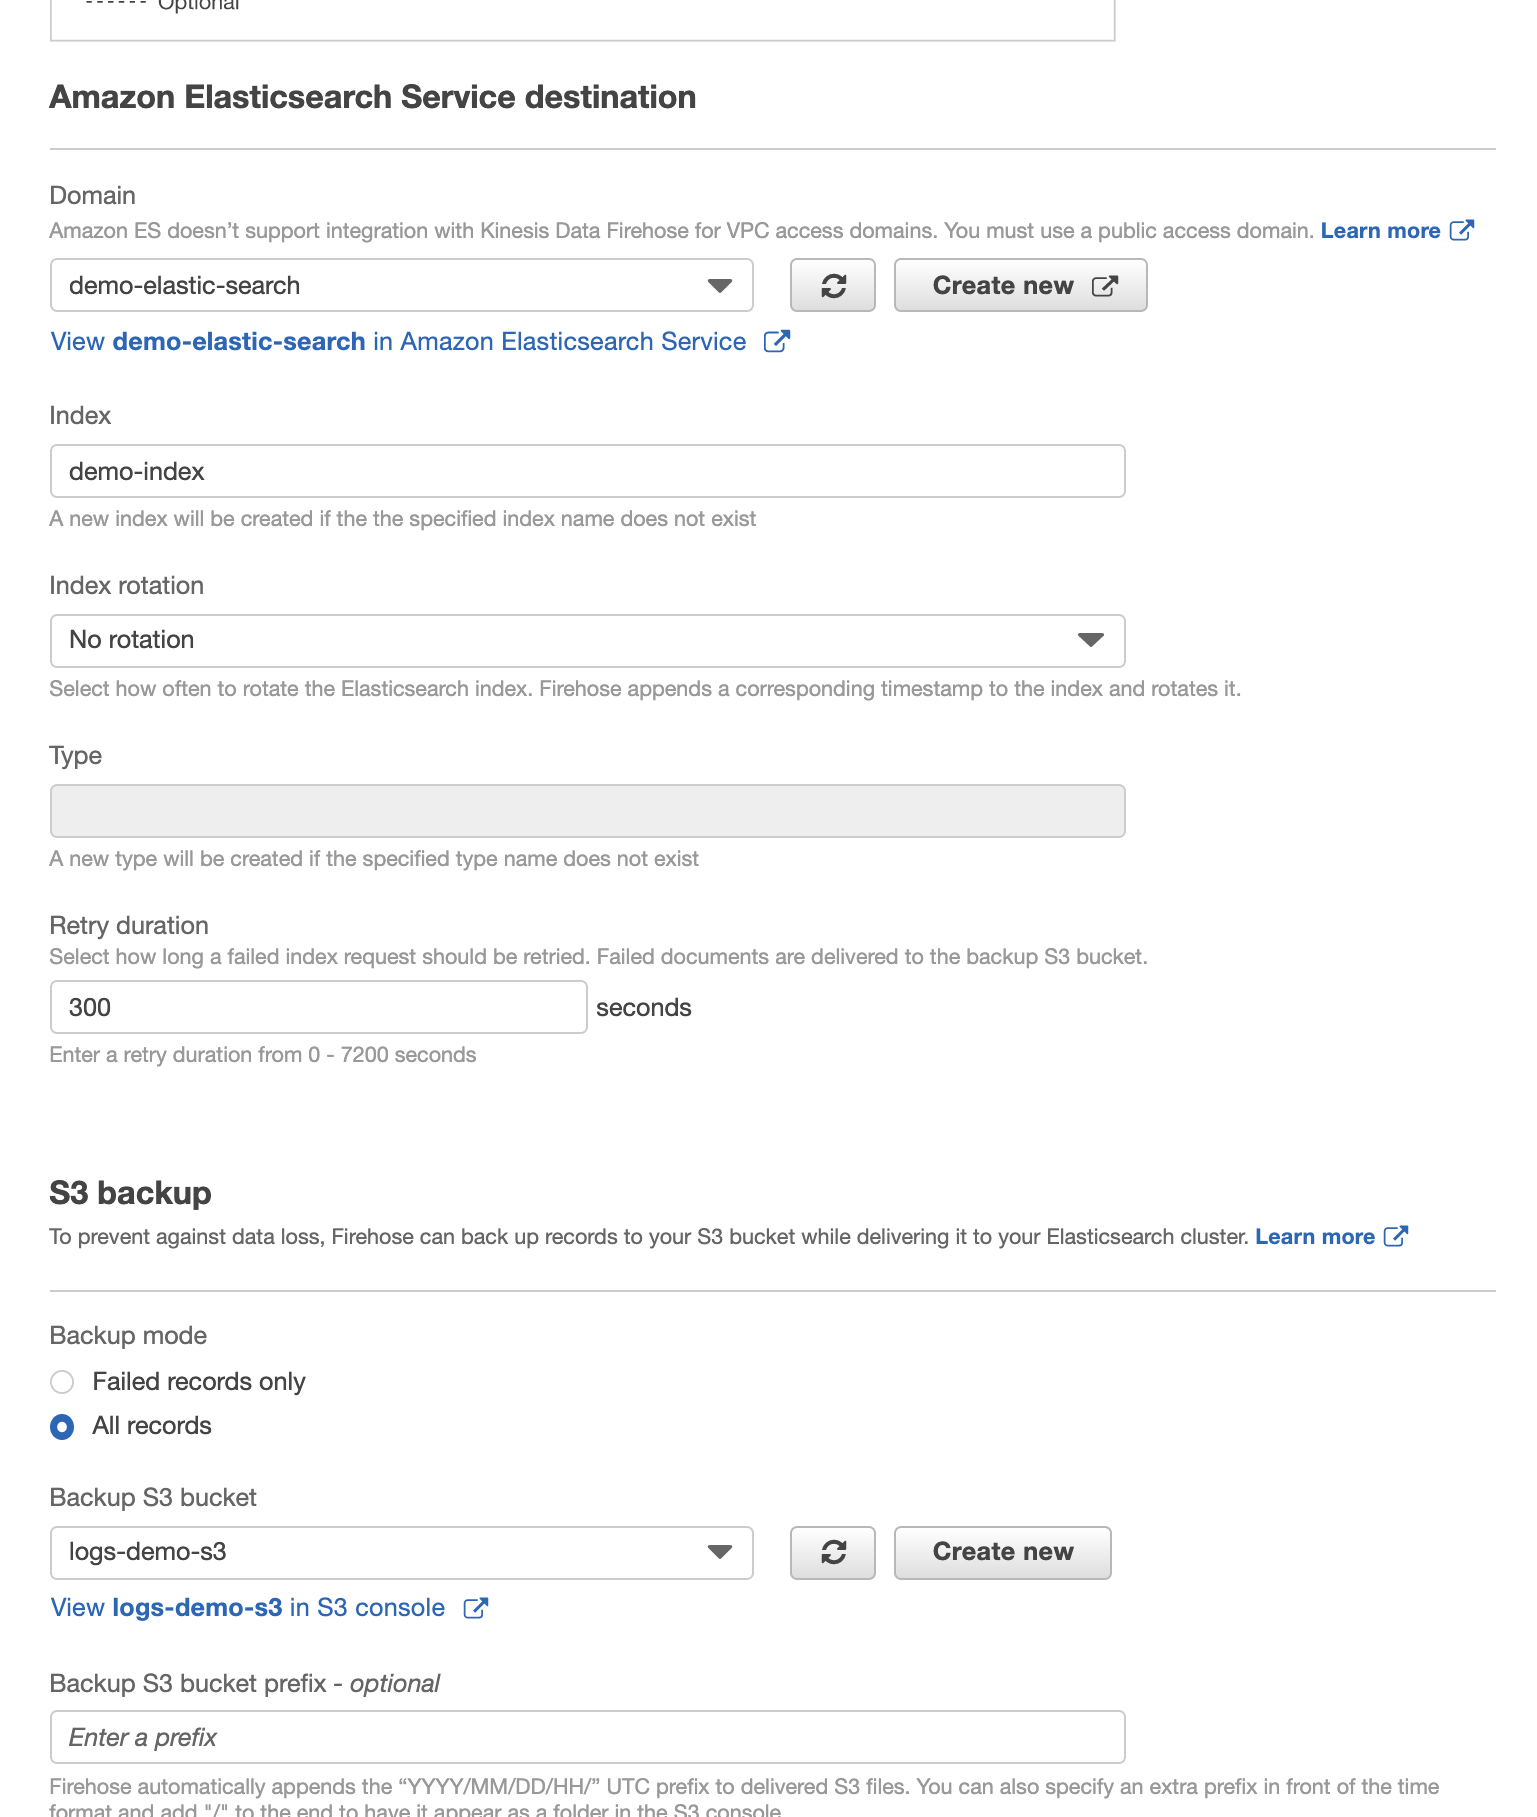
In the final step, complete the elastic search configuration as per your environment and resilience needs and create a new IAM role that allows Kinesis Firehose to write to ElasticSearch Cluster. Then review the summary and create the delivery stream.
Step 5: Create and Set policies in Master/Logging Account to allow data to be sent from Member Accounts
- Create policy (cwltrustpolicy.json) to assume the role from CloudWatch Logs
{
  "Statement": {
    "Effect": "Allow",
    "Principal": { "Service": "logs.region.amazonaws.com" },
    "Action": "sts:AssumeRole"
  }
}
Run this in Master/Logging account. You can use profiles in AWS CLI to manage your credentials for different accounts.
aws iam create-role --role-name cwrole --assume-role-policy-document file://cwltrustpolicy.json
- Create a policy (cwlpermissions.json) to allow CloudWatchLogs to write to Kinesis
{
  "Statement": [
    {
      "Effect": "Allow",
      "Action": "kinesis:PutRecord",
      "Resource": "arn:aws:kinesis:region:<MASTER/LOGGING ACCOUNT ID>:stream/Demo_Kinesis_Stream"
    },
    {
      "Effect": "Allow",
      "Action": "iam:PassRole",
      "Resource": "arn:aws:iam::<MASTER/LOGGING ACCOUNT ID>:role/cwrole"
    }
  ]
}
- Associate the above policy to cwrole (in Master Account)
aws iam put-role-policy --role-name cwrole --policy-name cwlpolicy --policy-document file://cwlpermissions.json
- Ensure that the policy was associated. (in Master Account)
aws iam get-role-policy --role-name cwrole --policy-name cwlpolicy
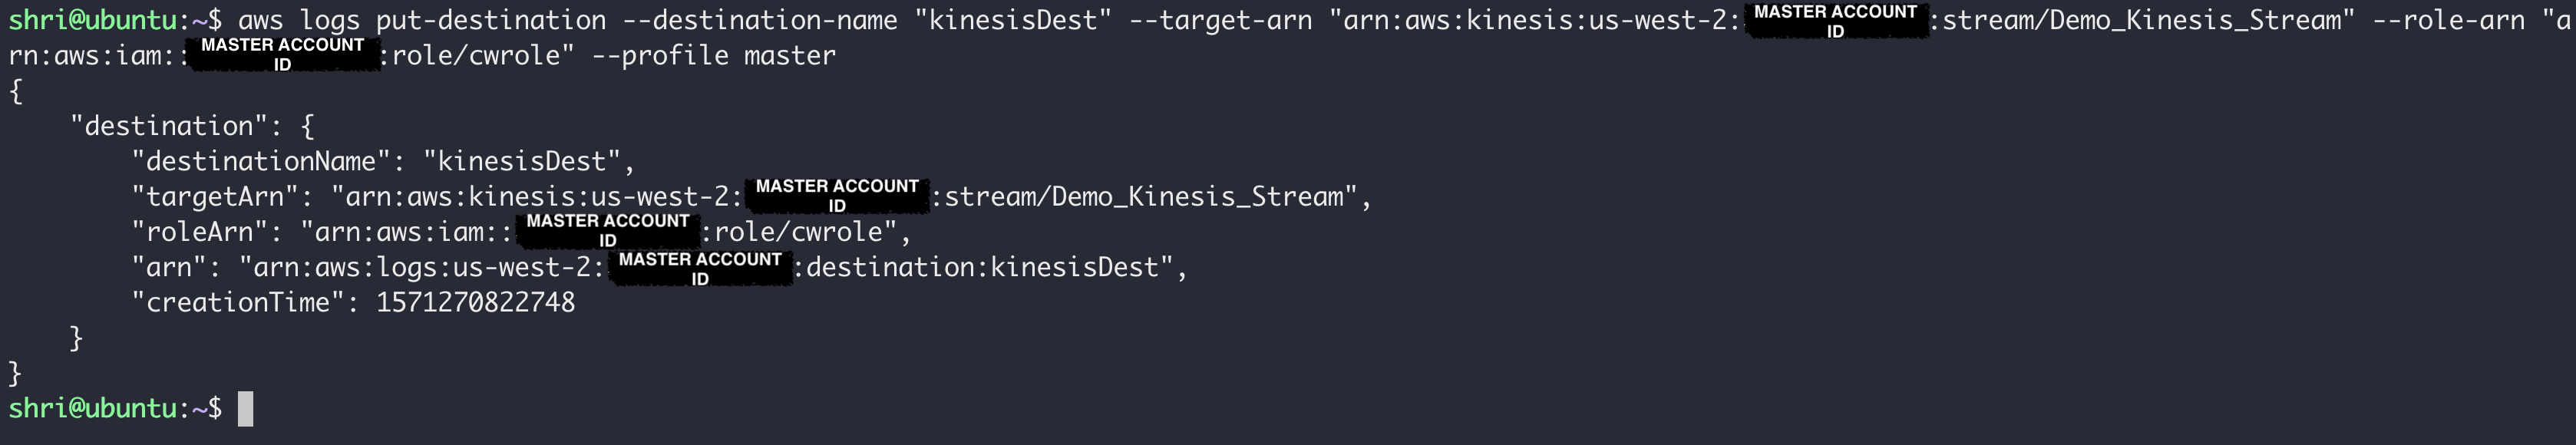
- Create a destination endpoint to which the logs would be sent (in Master Account)
aws logs put-destination --destination-name "kinesisDest" --target-arn "arn:aws:kinesis:us-west-2:<MASTER ACCOUNT ID>:stream/Demo_Kinesis_Stream" --role-arn "arn:aws:iam::<MASTER ACCOUNT ID>:role/cwrole"
Response from CLI
- Assign a destination policy that allows other AWS accounts to send data to Kinesis.
{
  "Version": "2012-10-17",
  "Statement": [
    {
      "Sid": "Stmt1571094446639",
      "Action": [
        "logs:PutSubscriptionFilter"
      ],
      "Principal" : {
          "AWS": [
      "MEMBER_ACCOUNT_1_ID",
      "MEMBER_ACCOUNT_2_ID"
      ]
         },
      "Effect": "Allow",
      "Resource": "arn:aws:logs:us-west-2:<MASTER_ACCOUNT_ID>:destination:kinesisDest"
    }
  ]
}
In the Master account run,
aws logs put-destination-policy --destination-name "kinesisDest" --access-policy file://destination_policy.json
Now, let’s set up VPC flow logs in Member Accounts.
Aggregating VPC Flow logs
Step 6: Setup CloudWatch Log Group (Member Account)
The first step is to setup CloudWatch Log group in all the member_account(s). This can be done via AWS CLI/AWS SDK or AWS Web Console.
Navigate to Services > CloudWatch > Logs > Create log group
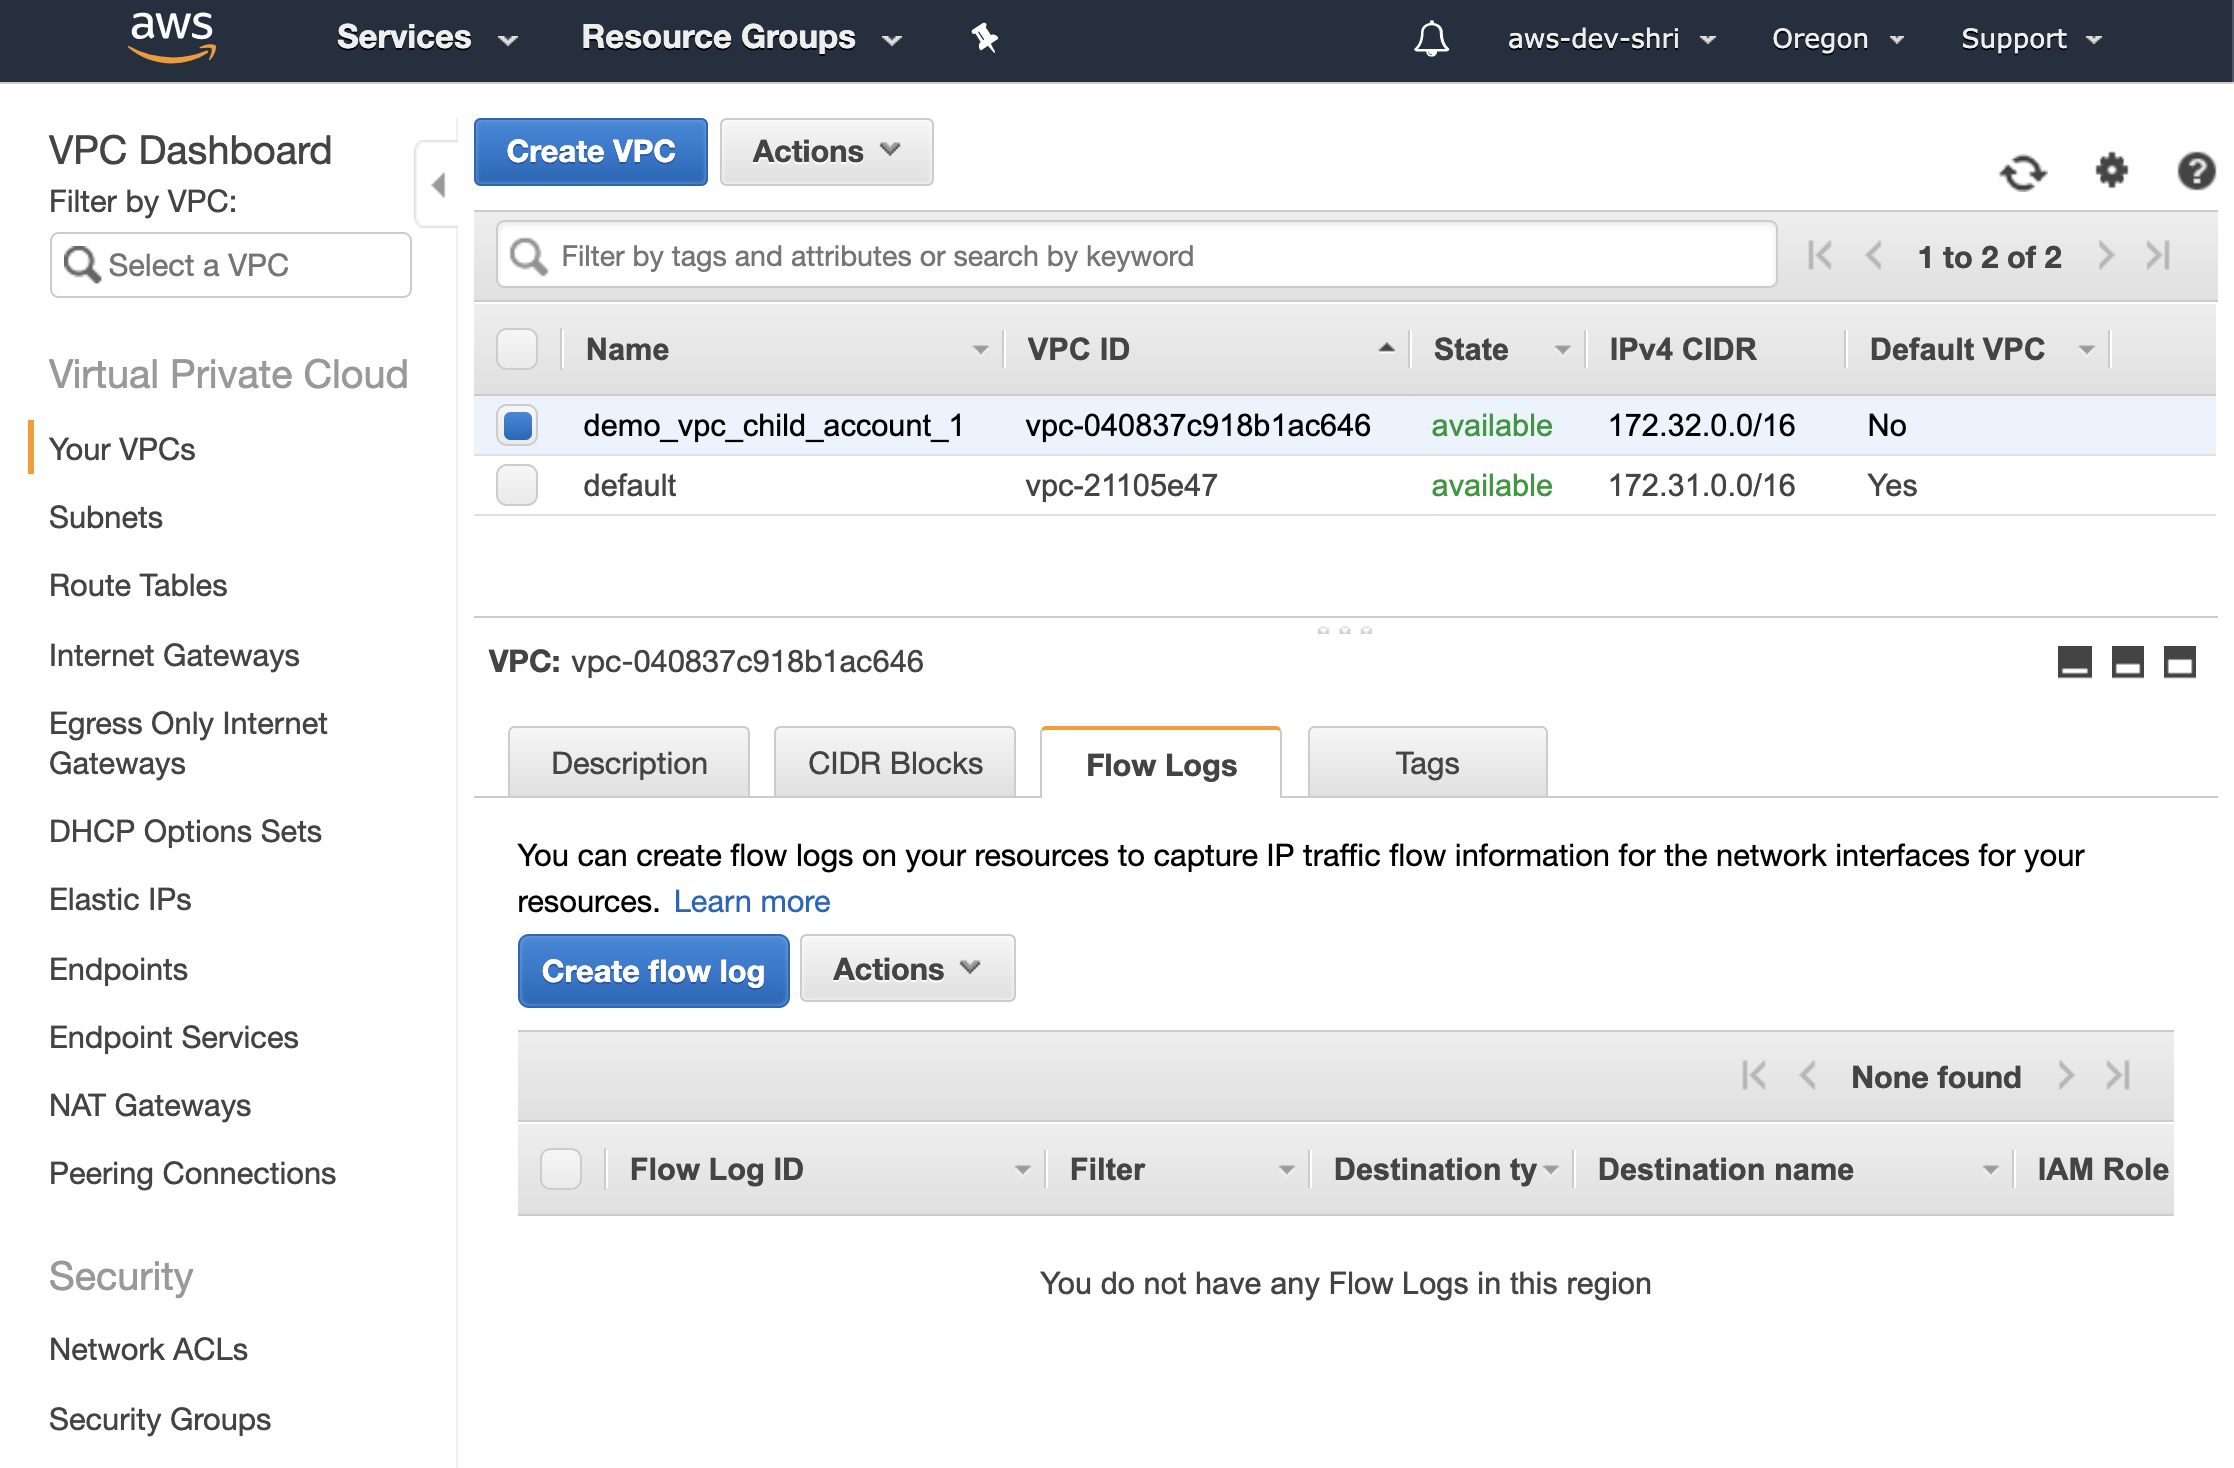
Step 7: Setup VPC Flow Logs (Member Account)
The first step is to enable VPC Flow logs across all of your VPCs in all of the member_account. This can be done either via AWS CLI, AWS SDK or the web console.
Navigate to Services > VPC > Your VPCs and select the VPC of interest. Then in the bottom pane, click on Flow Logs > Create flow log. I will call it cwl_vpc_fl_member_account_1 (Refers to account 1)
On the next page, Select the Filter. This indicates the type of VPC logs that you want AWS to capture. Choose ALL to log both accepted and rejected traffic. Then select the Destination as CloudWatch Logs.
From the drop-down choose the Destination log group.
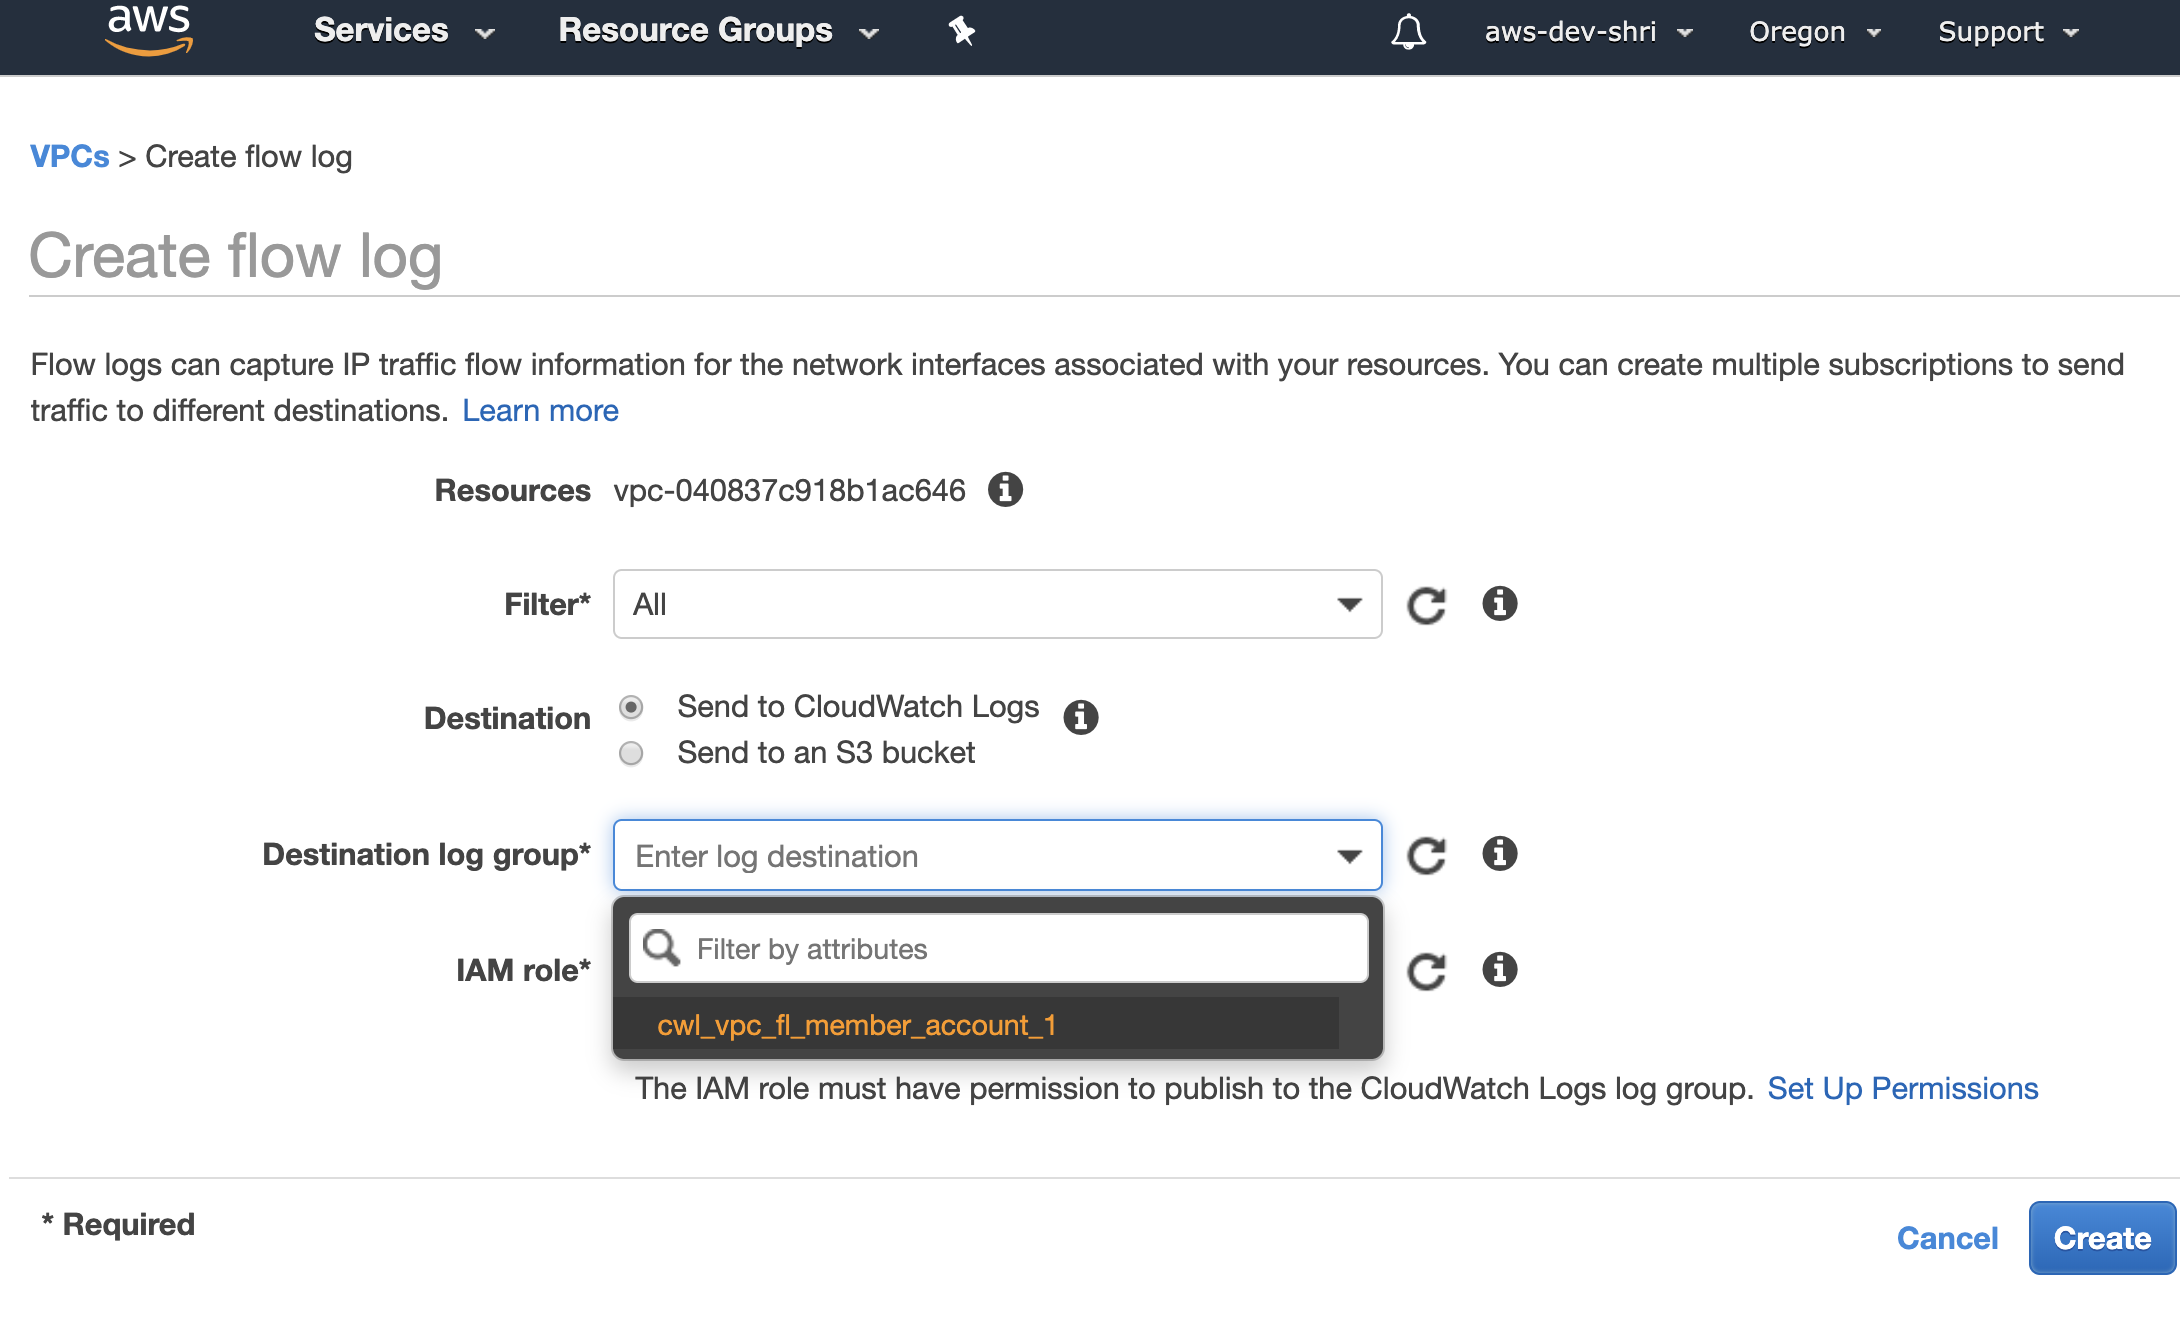
Finally, select an IAM role that allows VPC flow logs to be written to the CloudWatch Log group. If this is not already setup, then setup a role either by clicking on Set Up Permissions or by going to IAM and adding the policy, shown below, to a role. (In our case, the role is named Demo_flowlogsrole).
{
  "Statement": [
    {
      "Action": [
        "logs:CreateLogGroup",
        "logs:CreateLogStream",
        "logs:DescribeLogGroups",
        "logs:DescribeLogStreams",
        "logs:PutLogEvents"
      ],
      "Effect": "Allow",
      "Resource": "*"
    }
  ]
}
Copy the ARN of the Demo_flowlogsrole and Repeat the same steps across different accounts.
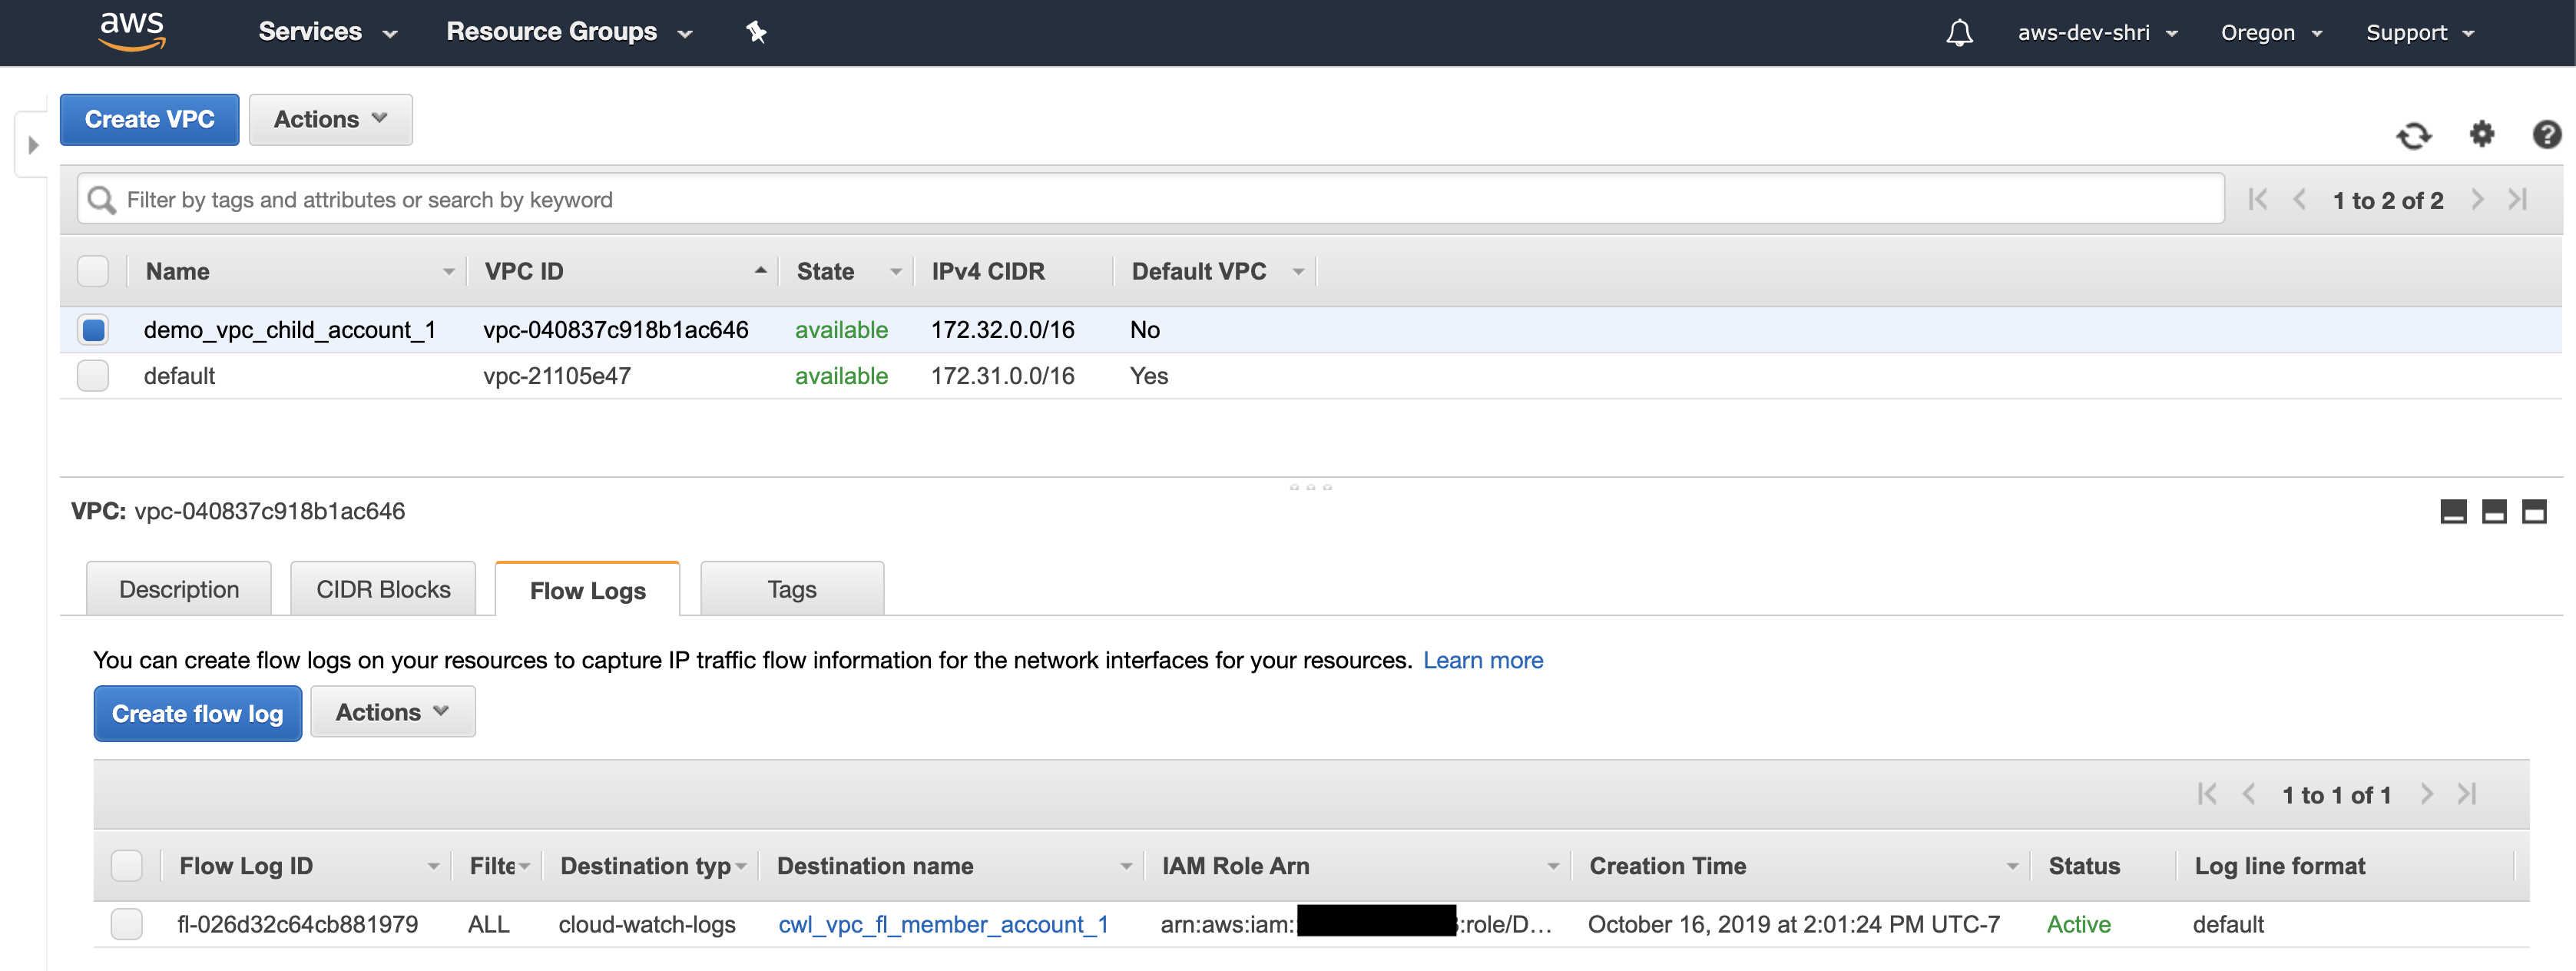
This will start forwarding VPC flow logs from all VPCs to the CloudWatch log group
Step 8: Create a subscription filter in Member Account(s) to send data to Kinesis Stream
- Execute this command to obtain the destination arn from the Master Account [The –profile master stores creds for Master Account for AWS CLI]
aws logs describe-destinations --profile master
It has format similar to arn:aws:logs:us-west-2:<MASTER_ACCOUNT_ID>:destination:kinesisDest
- Now in the member accounts, setup the subscription filter to forward logs to kinesis
In the command below, use the log group created in step 6.
aws logs put-subscription-filter --log-group-name "cwl_vpc_fl_member_account_1" --destination-arn arn:aws:logs:us-west-2:<MASTER_ACCOUNT_ID>:destination:kinesisDest --filter-name "vpc_flow_logs_filter" --filter-pattern " " --profile dev1
You should now see data in Elastic Search.
Aggregrating CloudTrail Logs
In this section, we will discuss the aggregation of CloudTrail logs. We will use some of the same resources created in the previous step.
- Enable Cloudtrail in all the regions within Member Accounts.
While enabling across the organization, ensure that the S3 bucket to which the cloudtrail logs are sent is set to the bucket in the Logging/Master account as mentioned in Step 2. This is useful for long term storage of the logs.
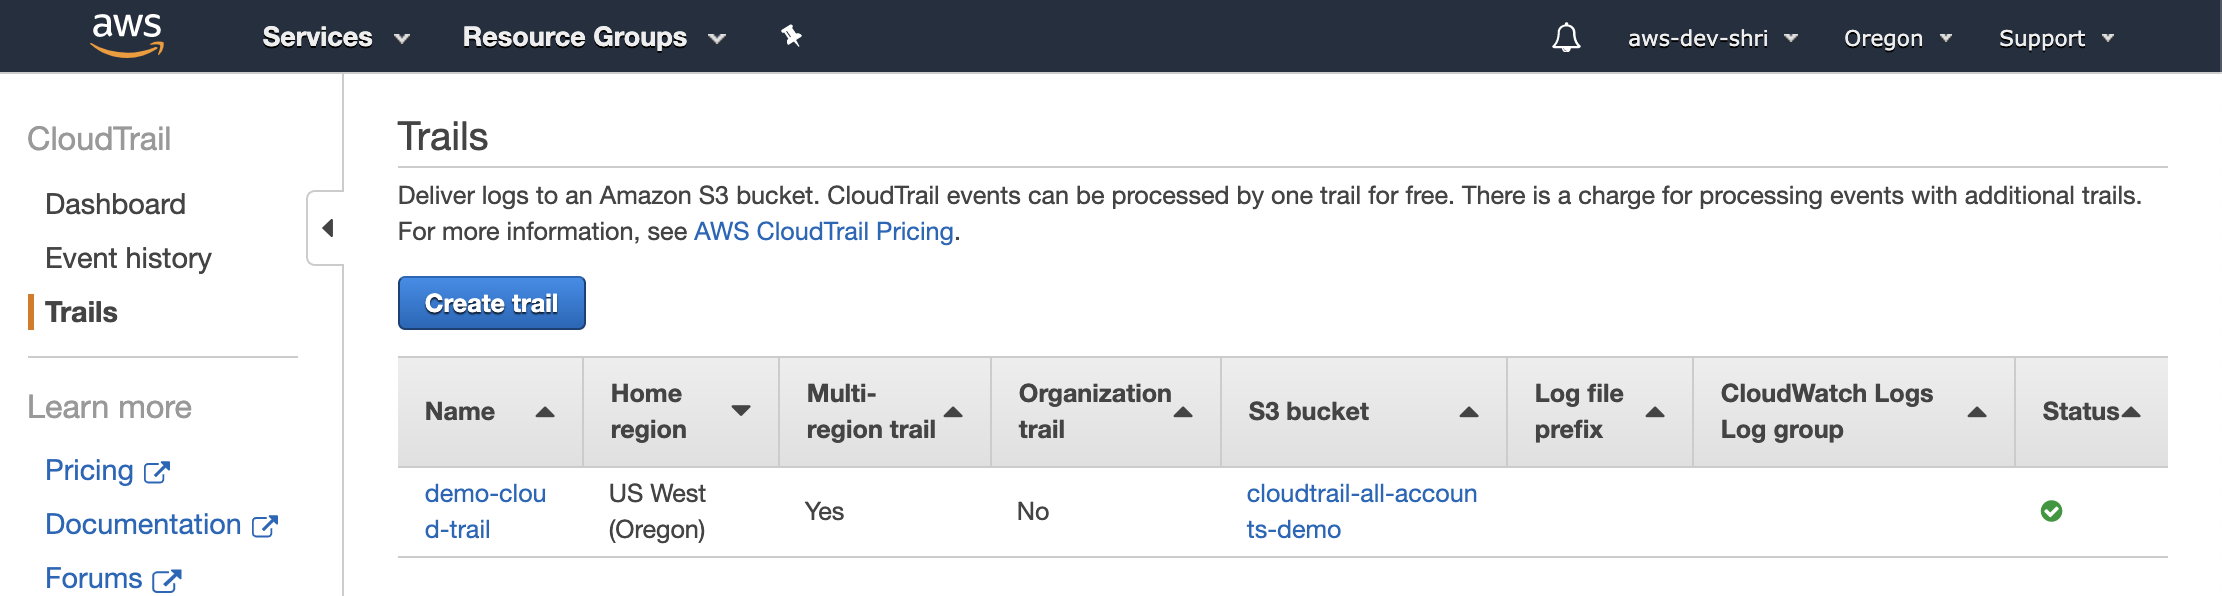
- Forward CloudTrail to CloudWatch Logs
Navigate to the CloudTrail Service and click on cloud trail created in the previous step. (demo-cloud-trail)
Then, go to the section Cloudwatch Logs and click on Configure.
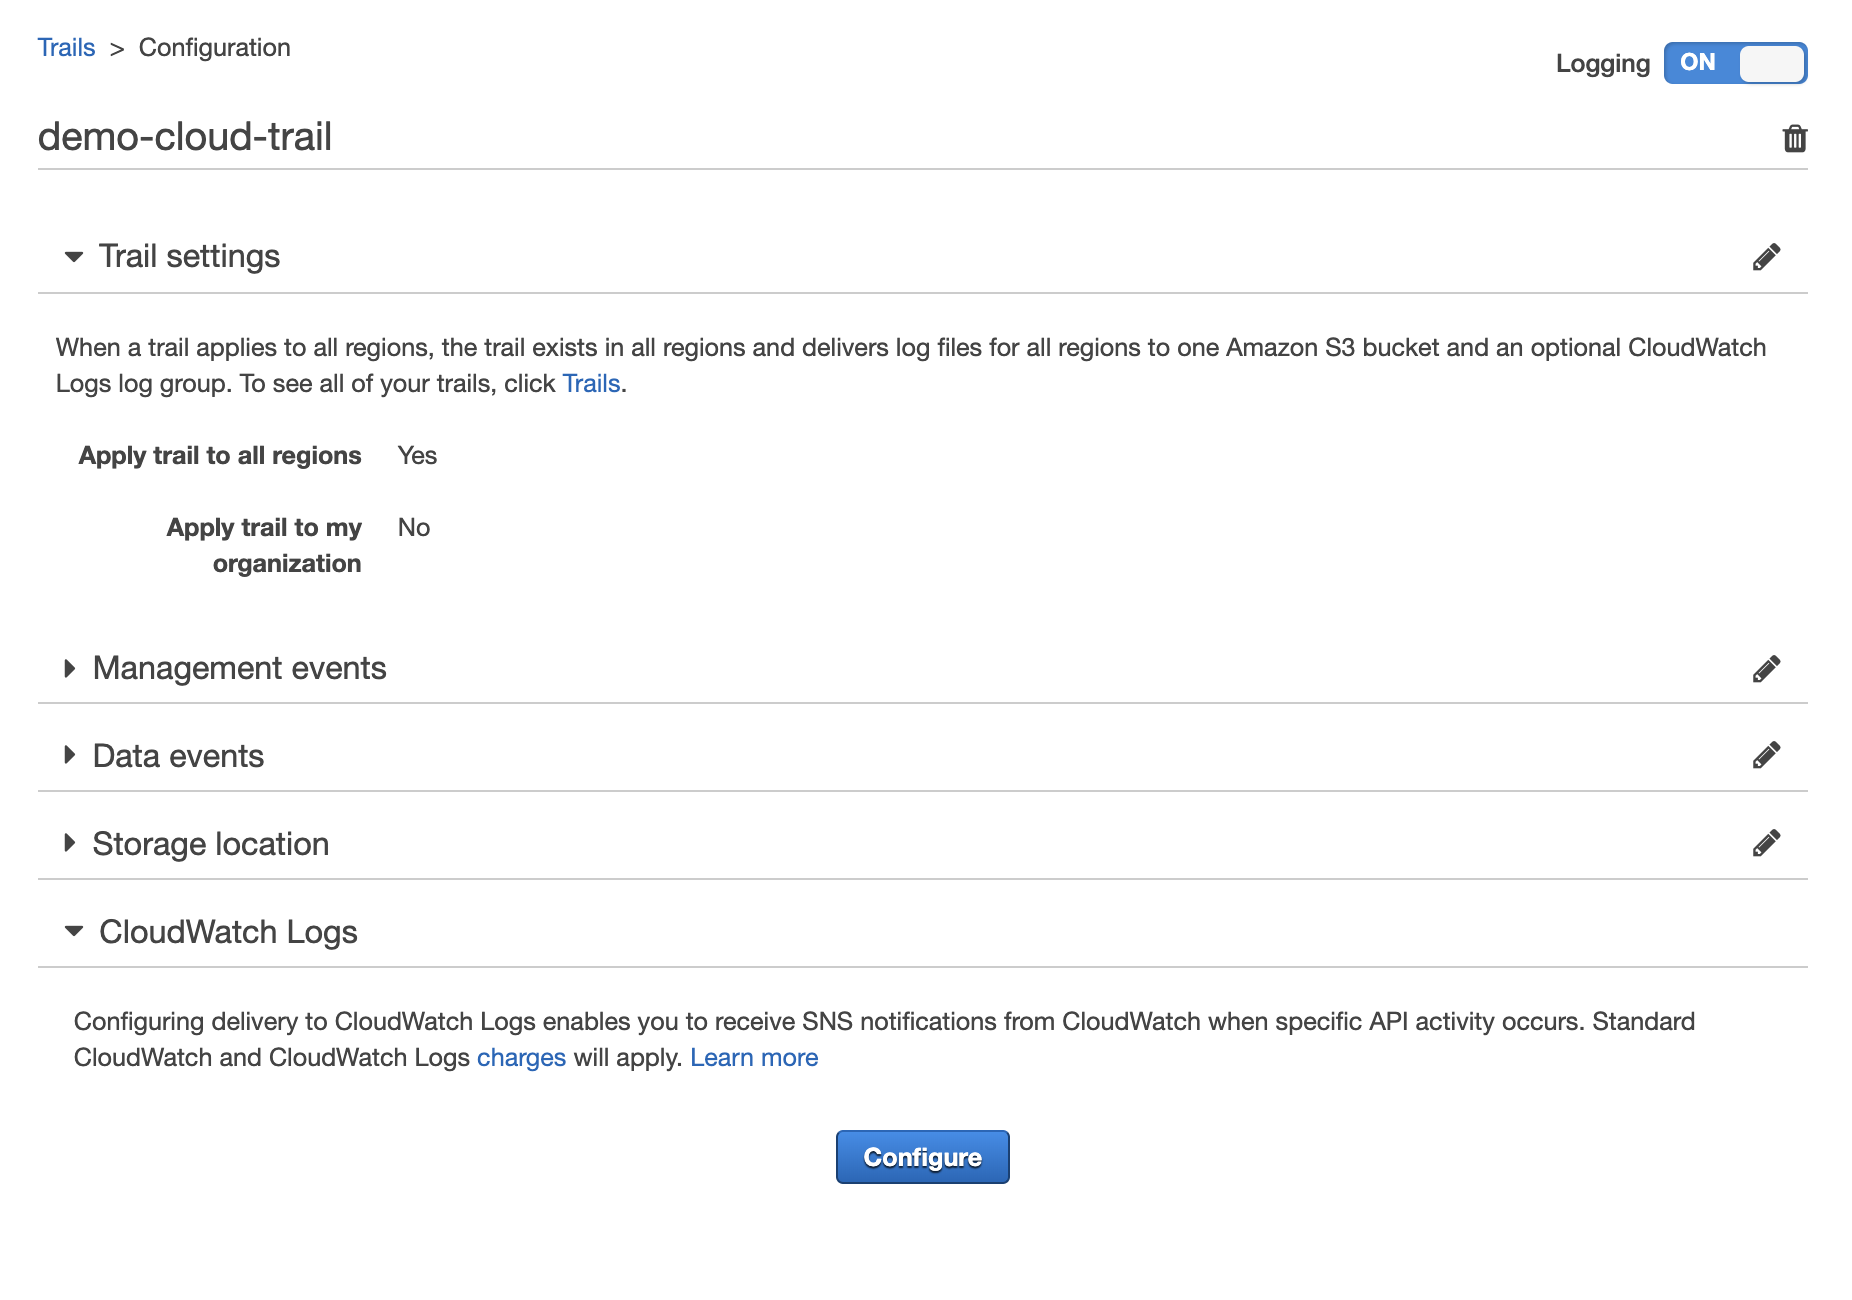
Provide the name of the Cloudwatch log group
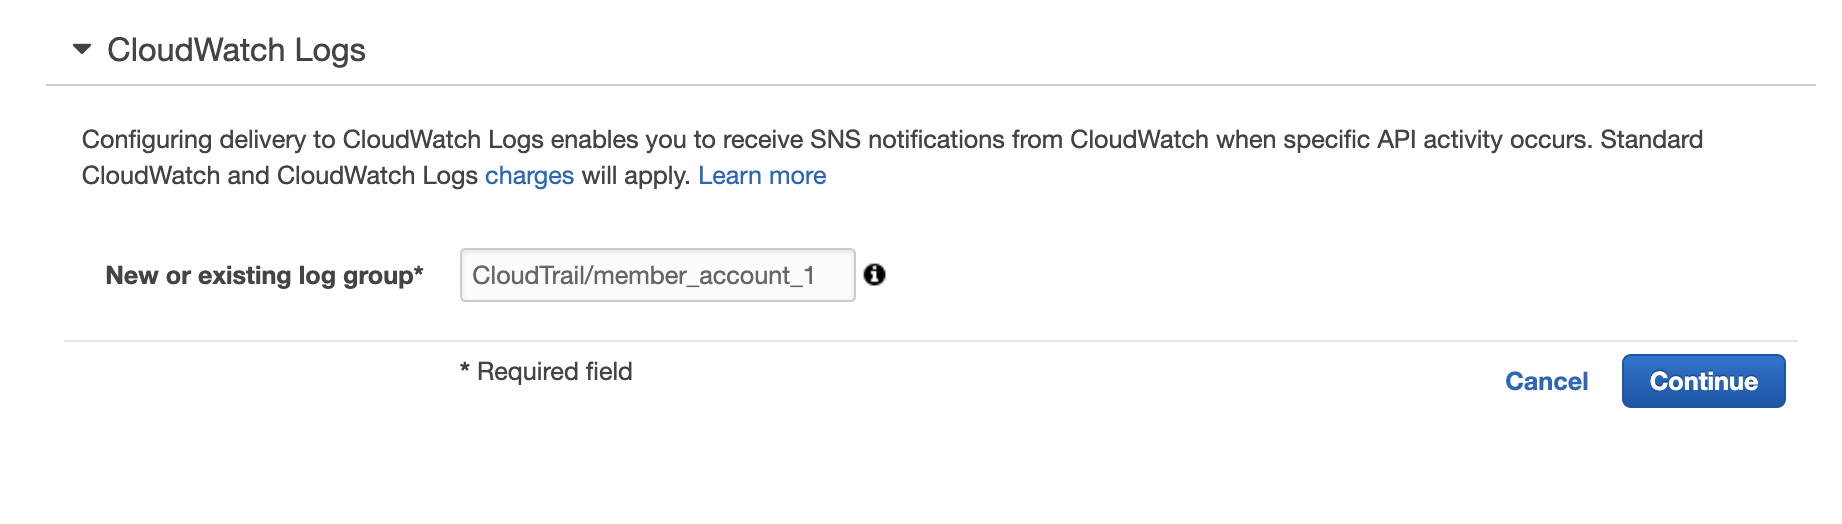
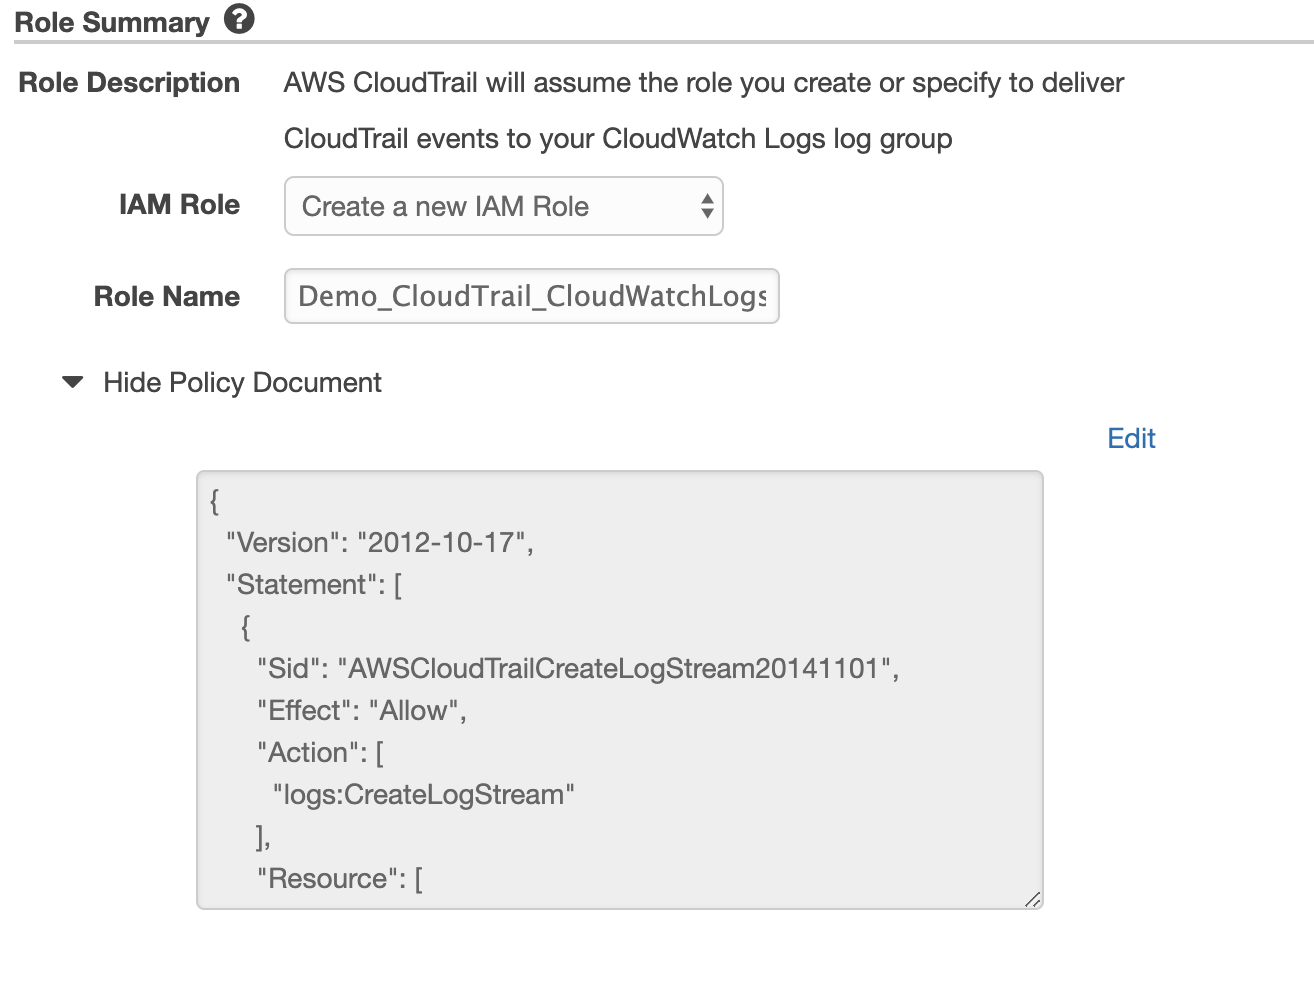
This will then take you to the IAM configuration to create a role that gives CloudTrail permission to write to the CloudWatch log group.
- Now similar to the previous section, create a subscription filter to forward the logs from this CloudWatch log group to kinesis. (in Memeber Account)
aws logs put-subscription-filter --log-group-name "CloudTrail/member_account_1" --destination-arn arn:aws:logs:us-west-2:<MASTER_ACCOUNT_ID>:destination:kinesisDest --filter-name "ct_filter" --filter-pattern " "
Once this is setup you will start seeing both processed VPC flow logs and CloudTrail events from all the accounts in ElasticSearch.
Aggregating GuardDuty events
- The first step is to aggregate all GuardDuty events in the MASTER/Logging account. This can be done by sending invitations from the master account to member accounts. All you need is Member account ID and the email associated with the account.
Navigate to Services > GuardDuty > Enable GuardDuty
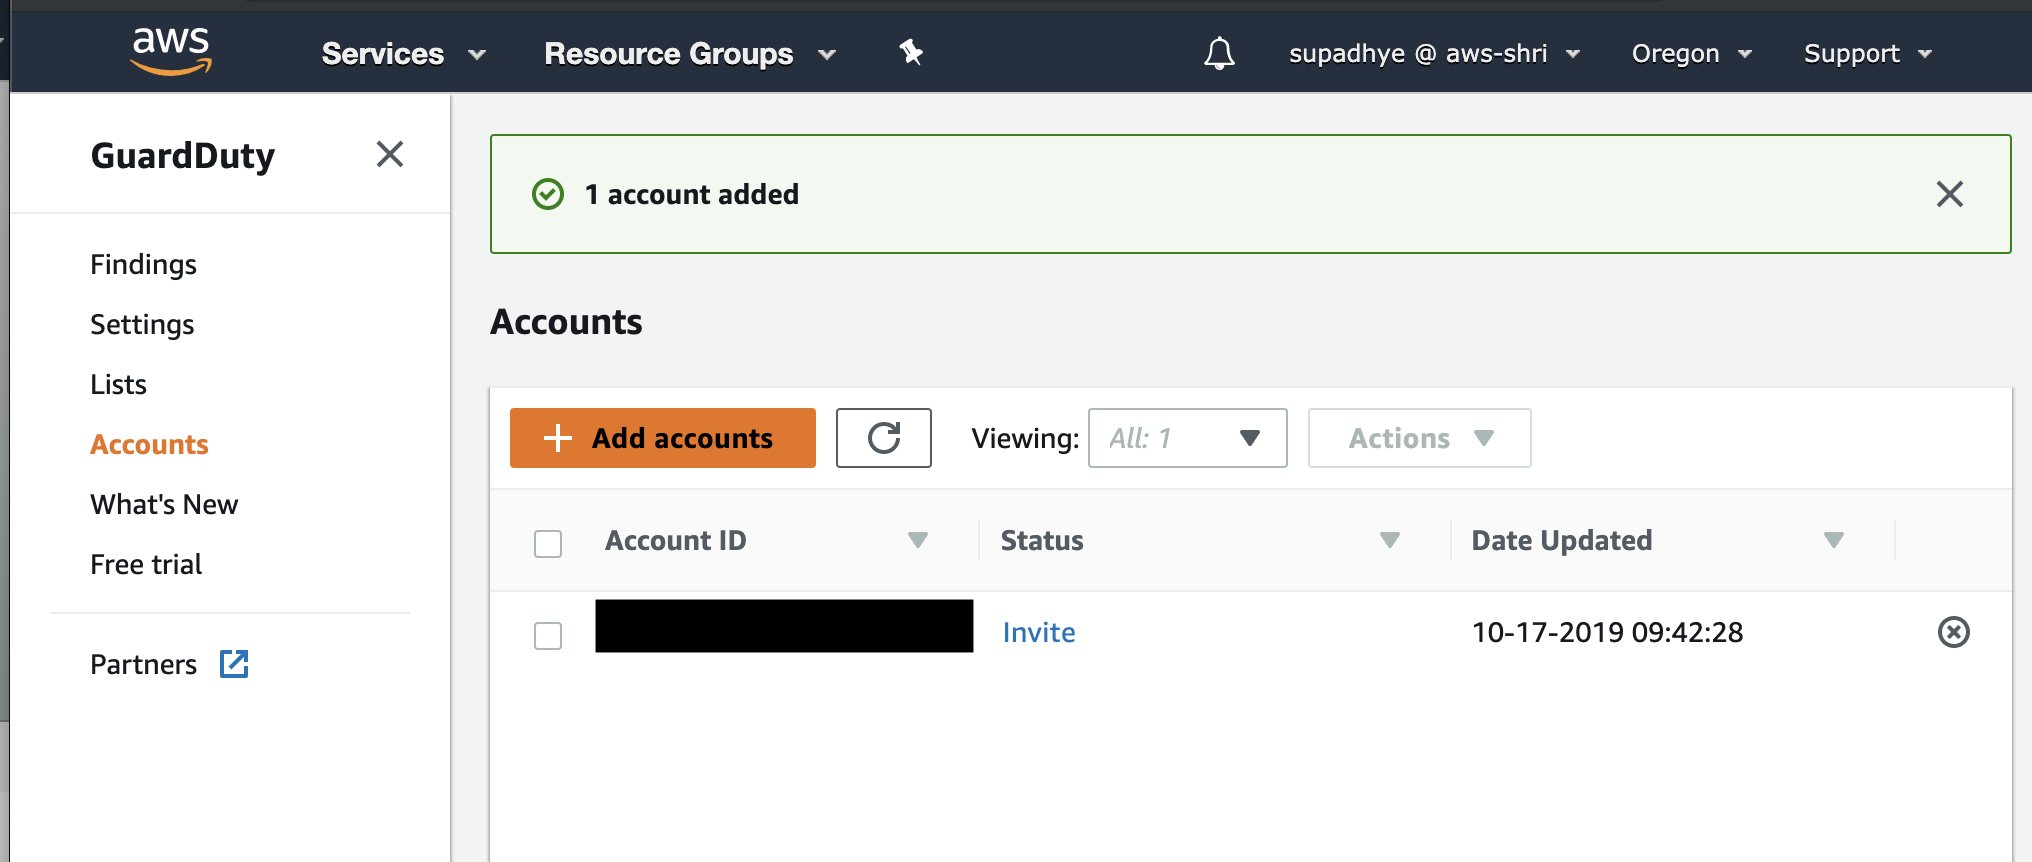
Then to add member accounts, go to GuardDuty > Accounts > Add Account
Provide the Account ID(s) of the member account and Email for the account. Once you do that, send an invite.
- Go to the Member Account and accept the invite. Before you do so, enable GuardDuty in the member accounts. (You can do this from Terraform or CFT across member accounts.)
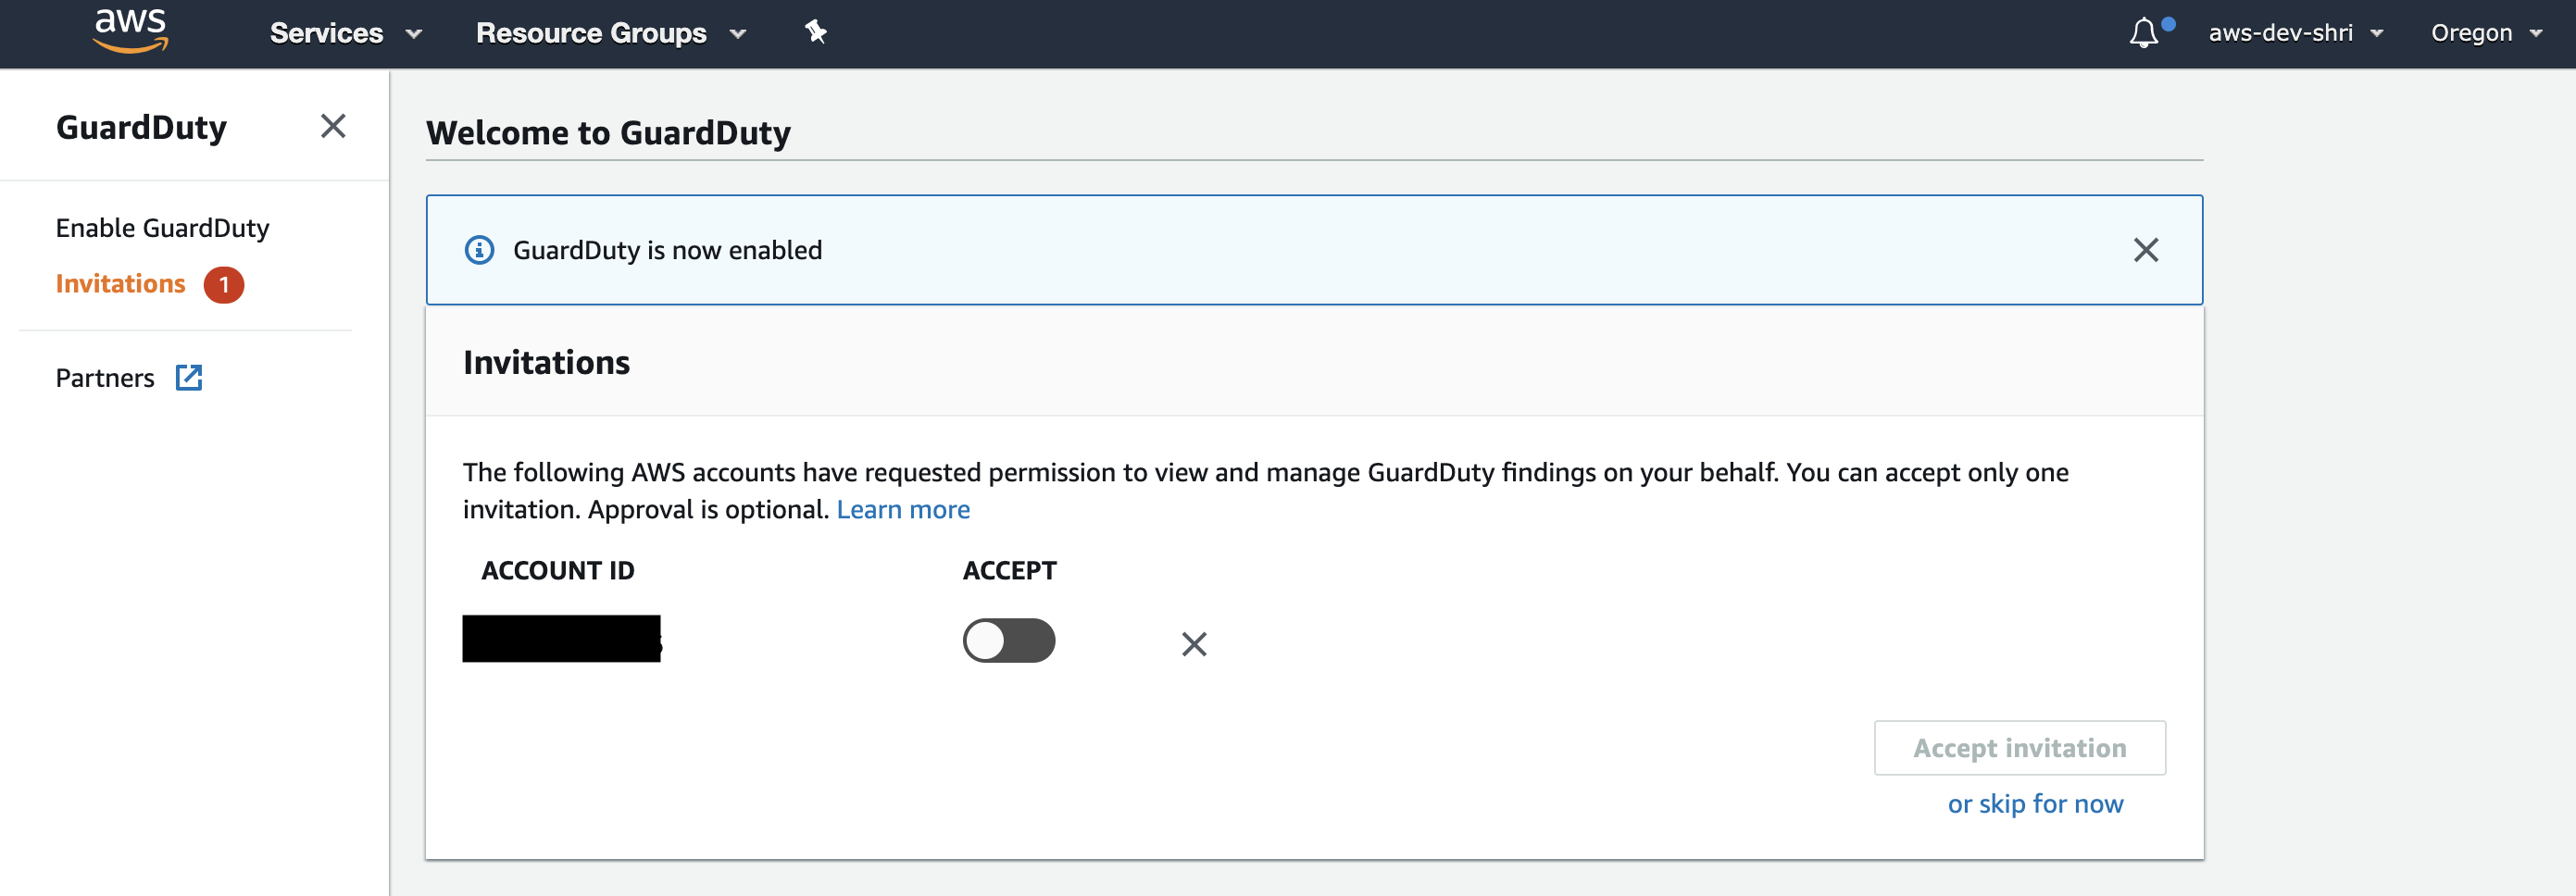
You will notice the GuardDuty events from all your member accounts will now be available in the Master/Logging account. This is useful if you like using the GuardDuty UI.
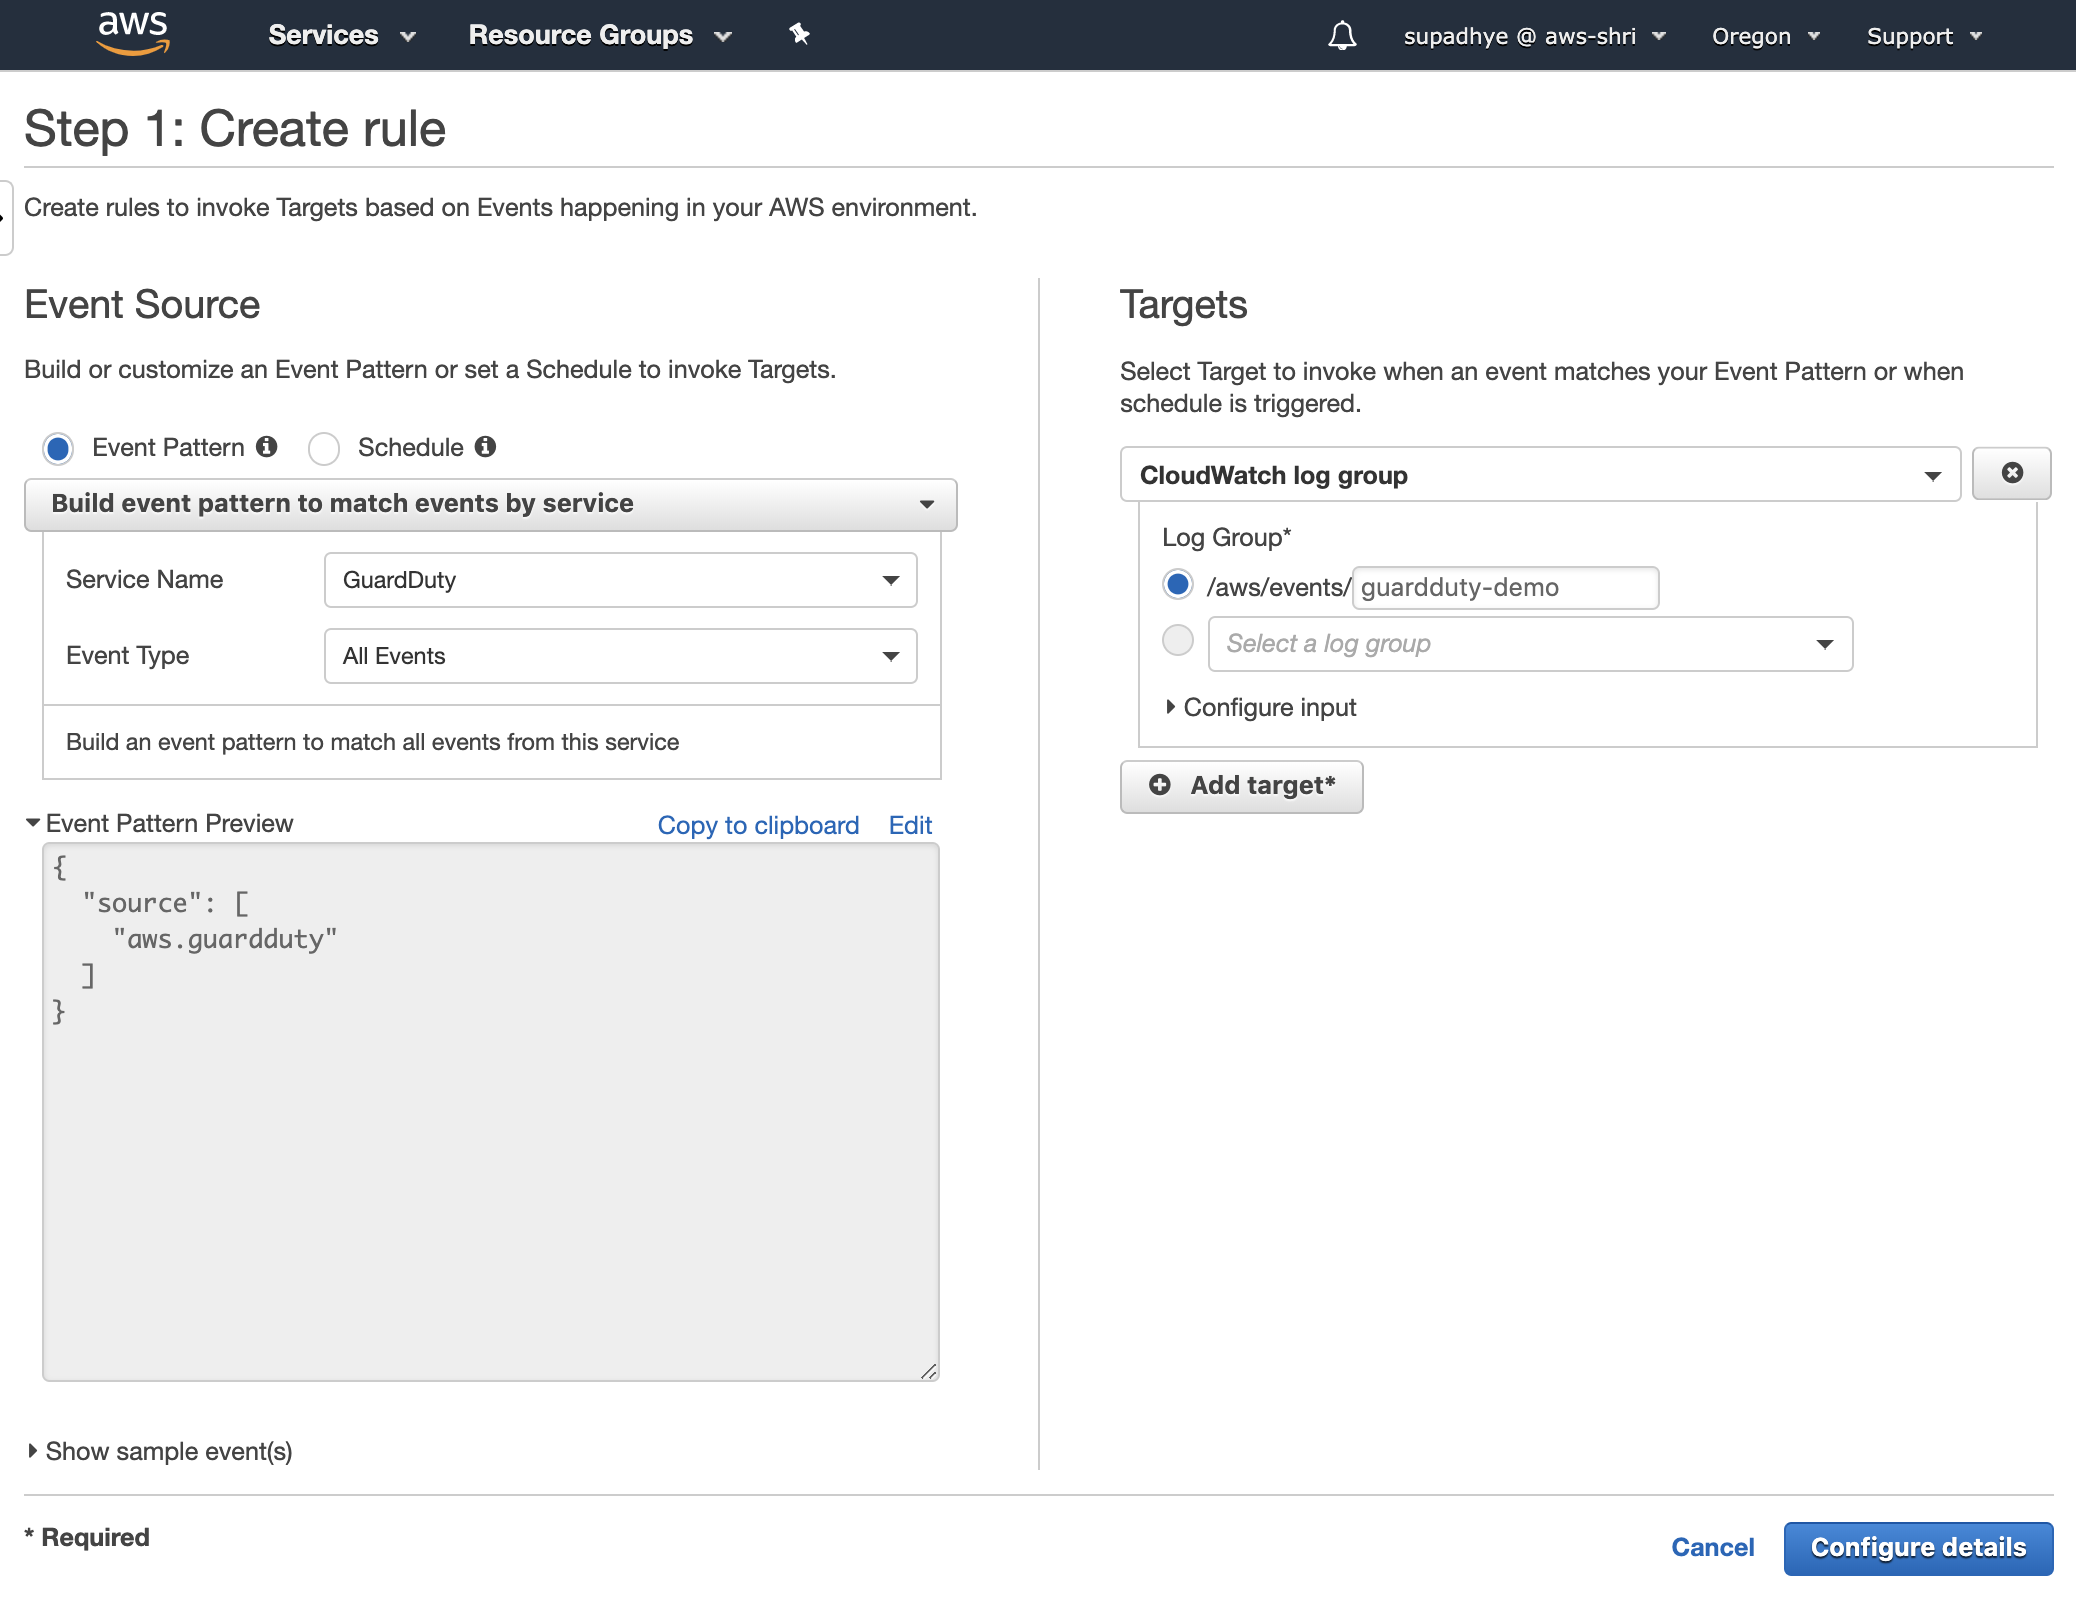
- Now, similar to other aggregations seen in earlier sections, we will forward these GuardDuty events to CloudWatch logs. (MASTER ACCOUNT)
To do this, go to CloudWatch > Events > Create Rule. Add the following details to it. Note, we are forwarding all the GuardDuty events stored in the Master account to the CloudWatch Log group.
- Update the destination policy to allow data from this account to be collected.
{
  "Version": "2012-10-17",
  "Statement": [
    {
      "Sid": "Stmt1571094446639",
      "Action": [
        "logs:PutSubscriptionFilter"
      ],
      "Principal" : {
          "AWS": [
            "MEMBER_ACCOUNT_1_ID",
            "MEMBER_ACCOUNT_2_ID",
            "MASTER_ACCOUNT_ID"
      ]
         },
      "Effect": "Allow",
      "Resource": "arn:aws:logs:us-west-2:<MASTER_ACCOUNT_ID>:destination:kinesisDest"
    }
  ]
}
Run this in Master Account
aws logs put-destination-policy --destination-name "kinesisDest" --access-policy file://destination_policy.json
- Finally, we will add a subscription filter to forward these CloudWatch Logs to Kinesis stream similar to the ones in previous sections. (Here we add subscription filter in the MASTER ACCOUNT)
aws logs put-subscription-filter --log-group-name "/aws/events/guardduty-demo" --destination-arn arn:aws:logs:us-west-2:<MASTER_ACCOUNT_ID>:destination:kinesisDest --filter-name "gd_filter" --filter-pattern " "
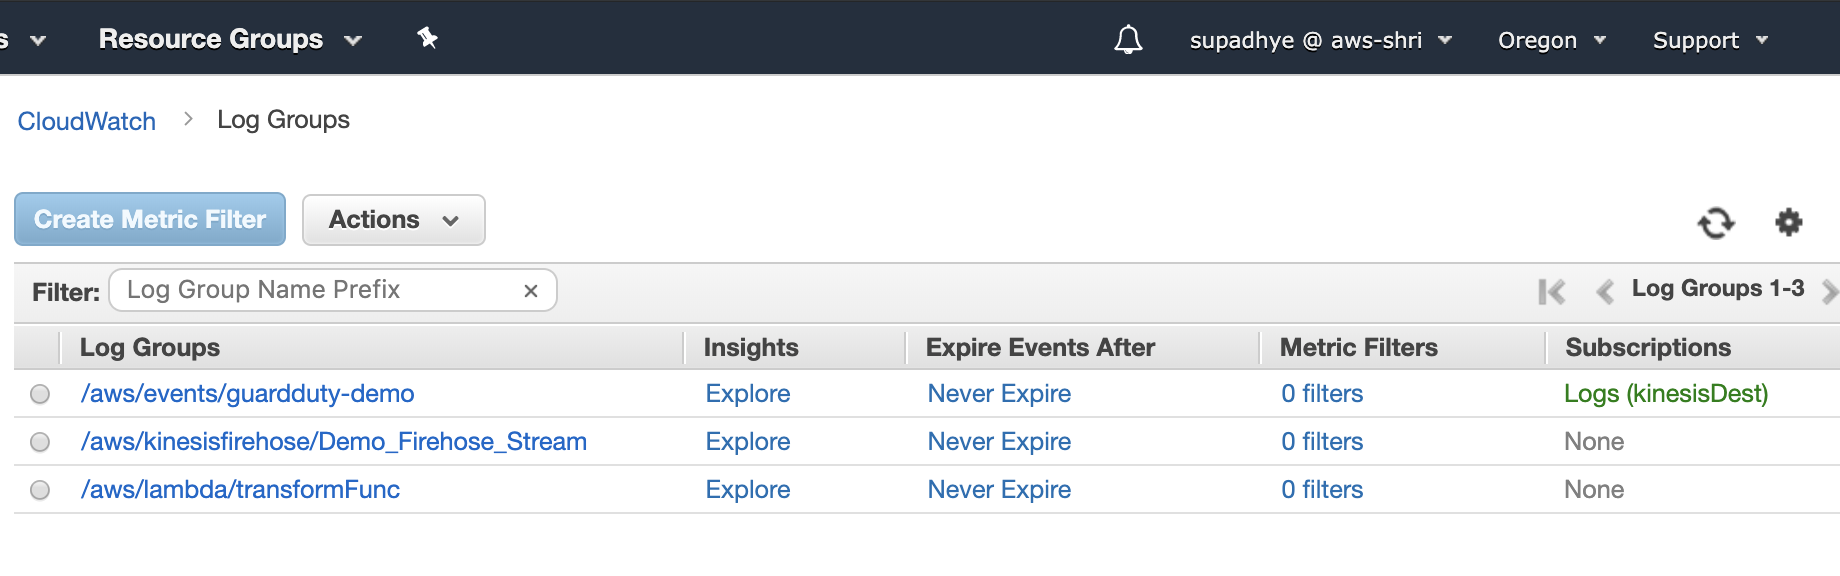
This should be the final state of your CloudWatch Log group
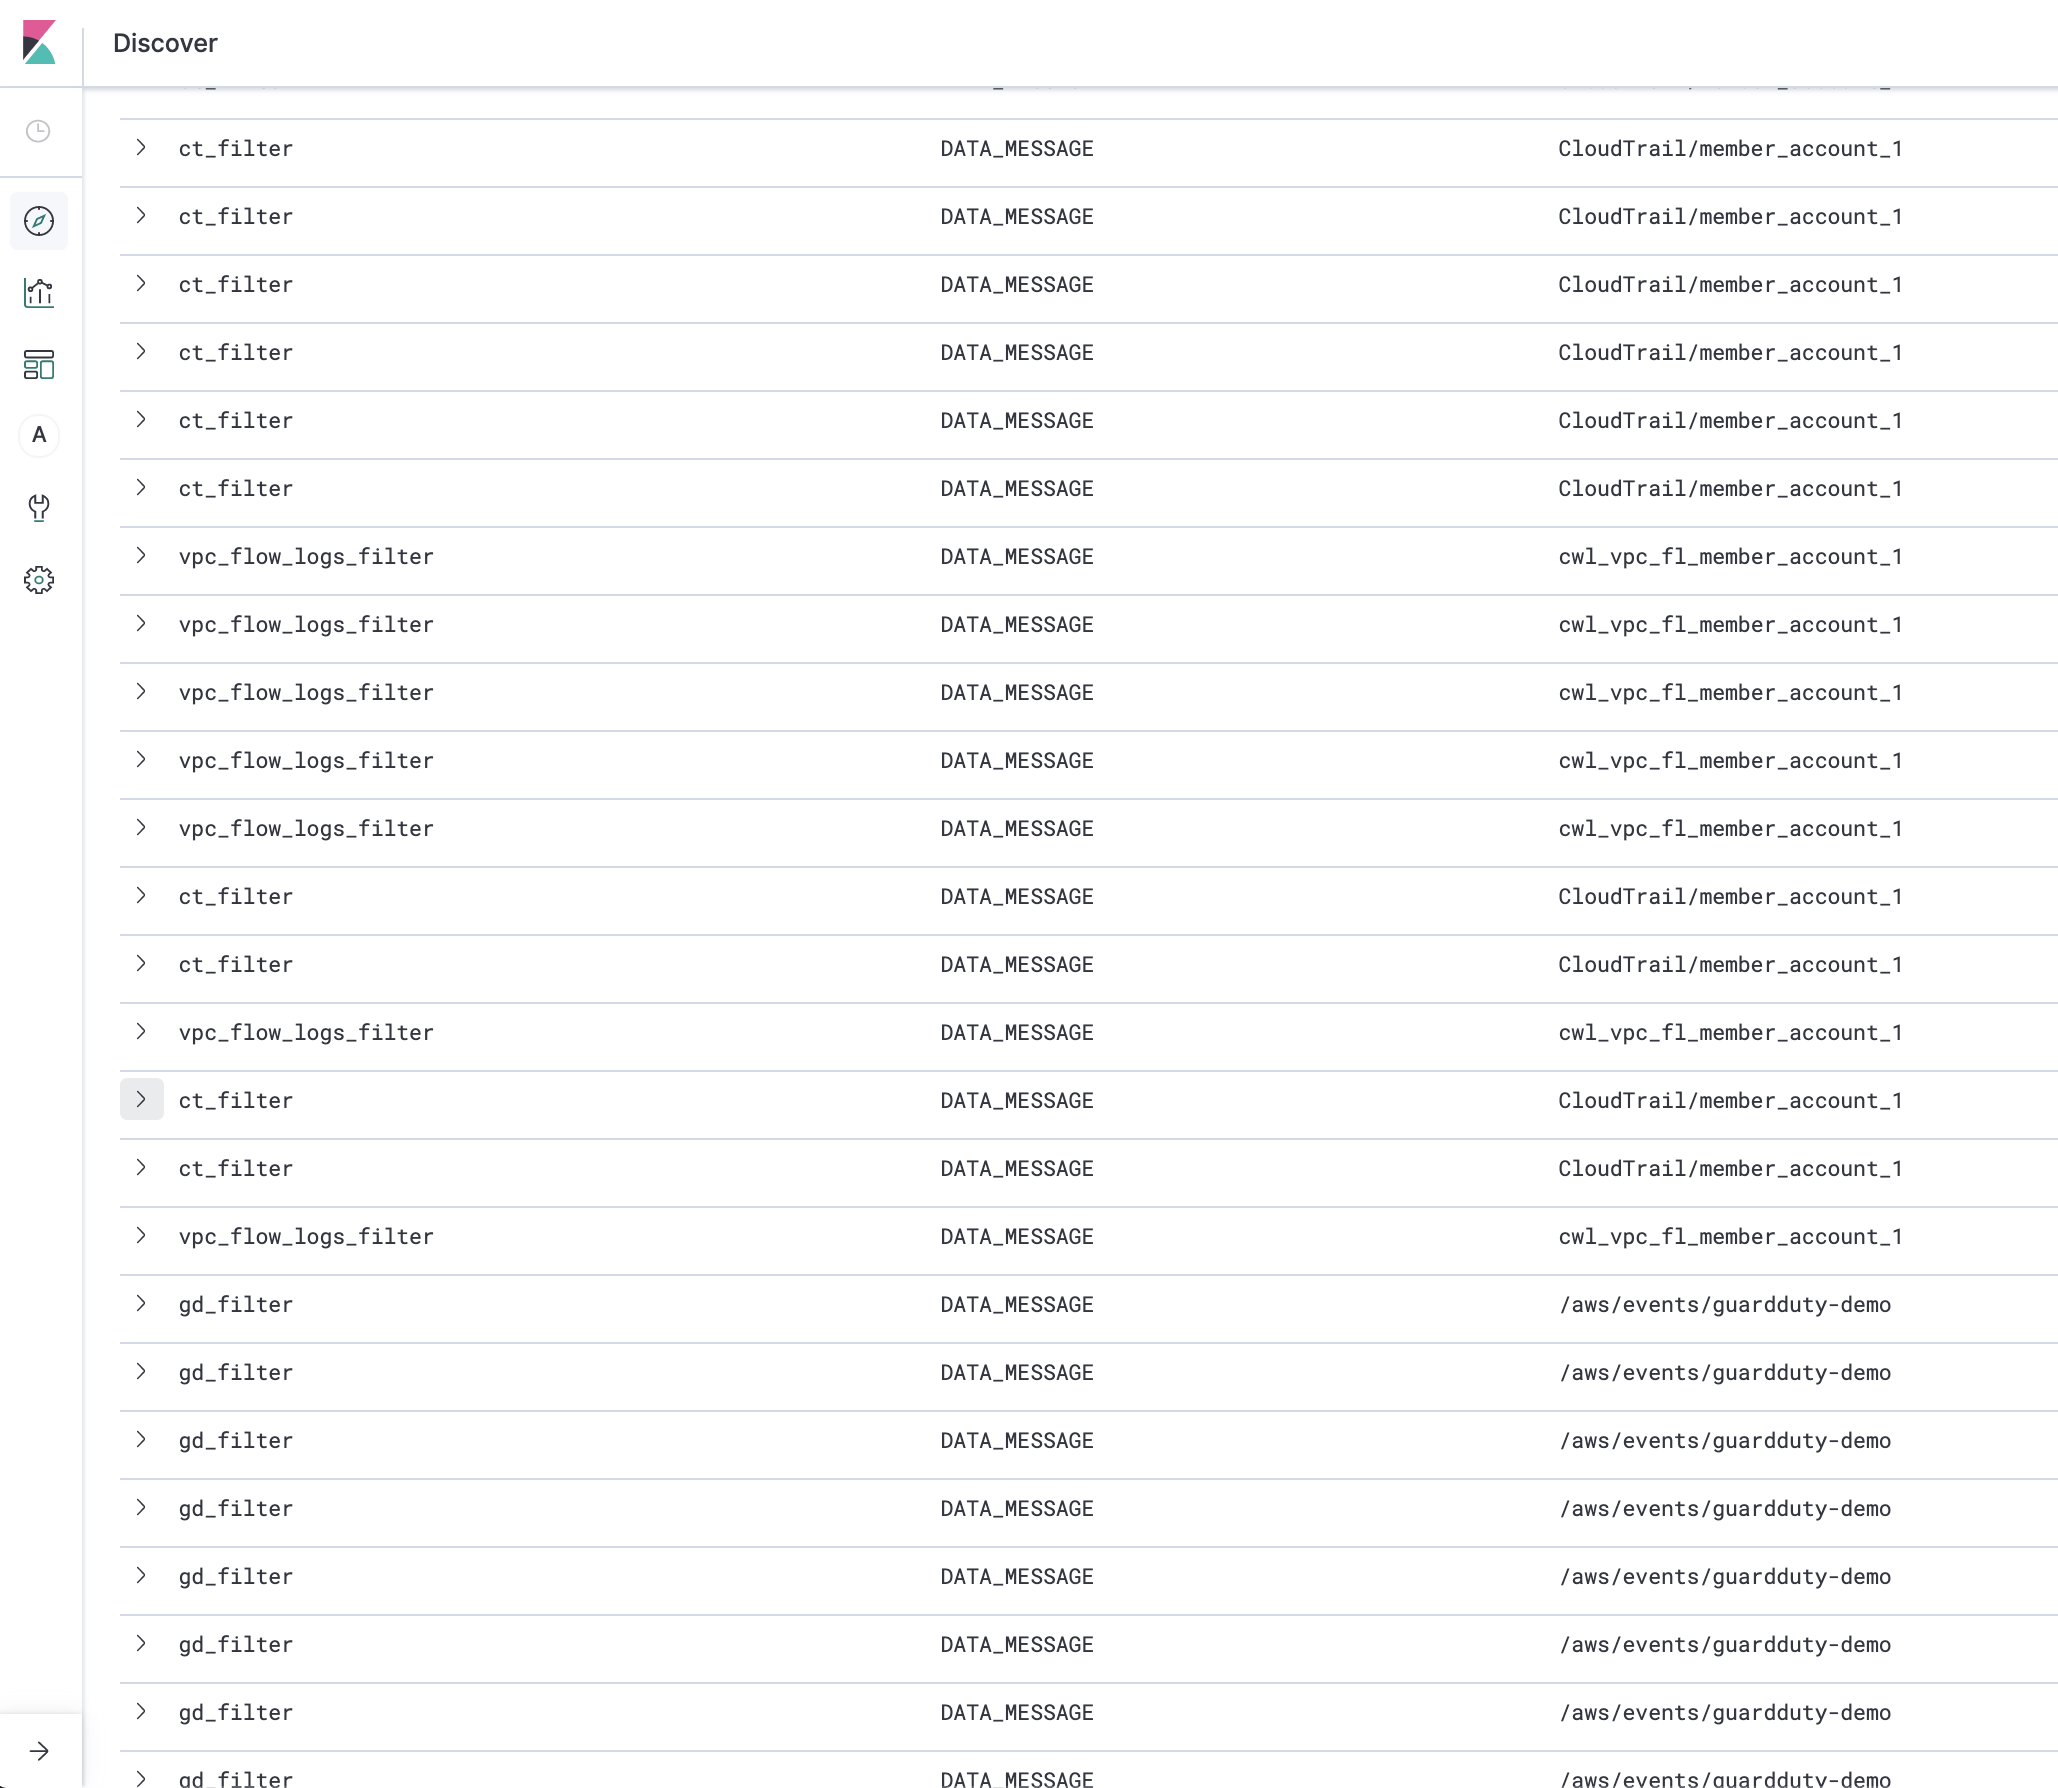
Kibana DashBoard
After applying necessary filters, you will start noticing the data in Kibana Dashboard
Conclusion
By implementing this architecture, you should get near real-time data in ElasticSearch for analysis (and send notifications using SNS). Also, you should see all the logs/events within your S3 bucket that is stored as a backup. You may choose to set policy so that these logs are archived to Glacier and other long term storage services.
The aggregated logs from the Master/Logging account can be forwarded to other external systems like Splunk/RedShift for analysis and VMWare Secure State for Cloud Security Posture Management.