Monitoring of infrastructure resources and applications within the public cloud, like AWS and Azure, is critical for audit, security, and compliance within the accounts. As the enterprises grow the number of accounts, the collection of these logs and events becomes more tedious. A common mechanism to achieve this is to use a separate AWS account for collecting all logs. AWS recommends using a separate account for collecting all the logs. So in case of a breach in other member accounts within an organization, the logs are never compromised.
In AWS, various services generate logs and events. These include:
-
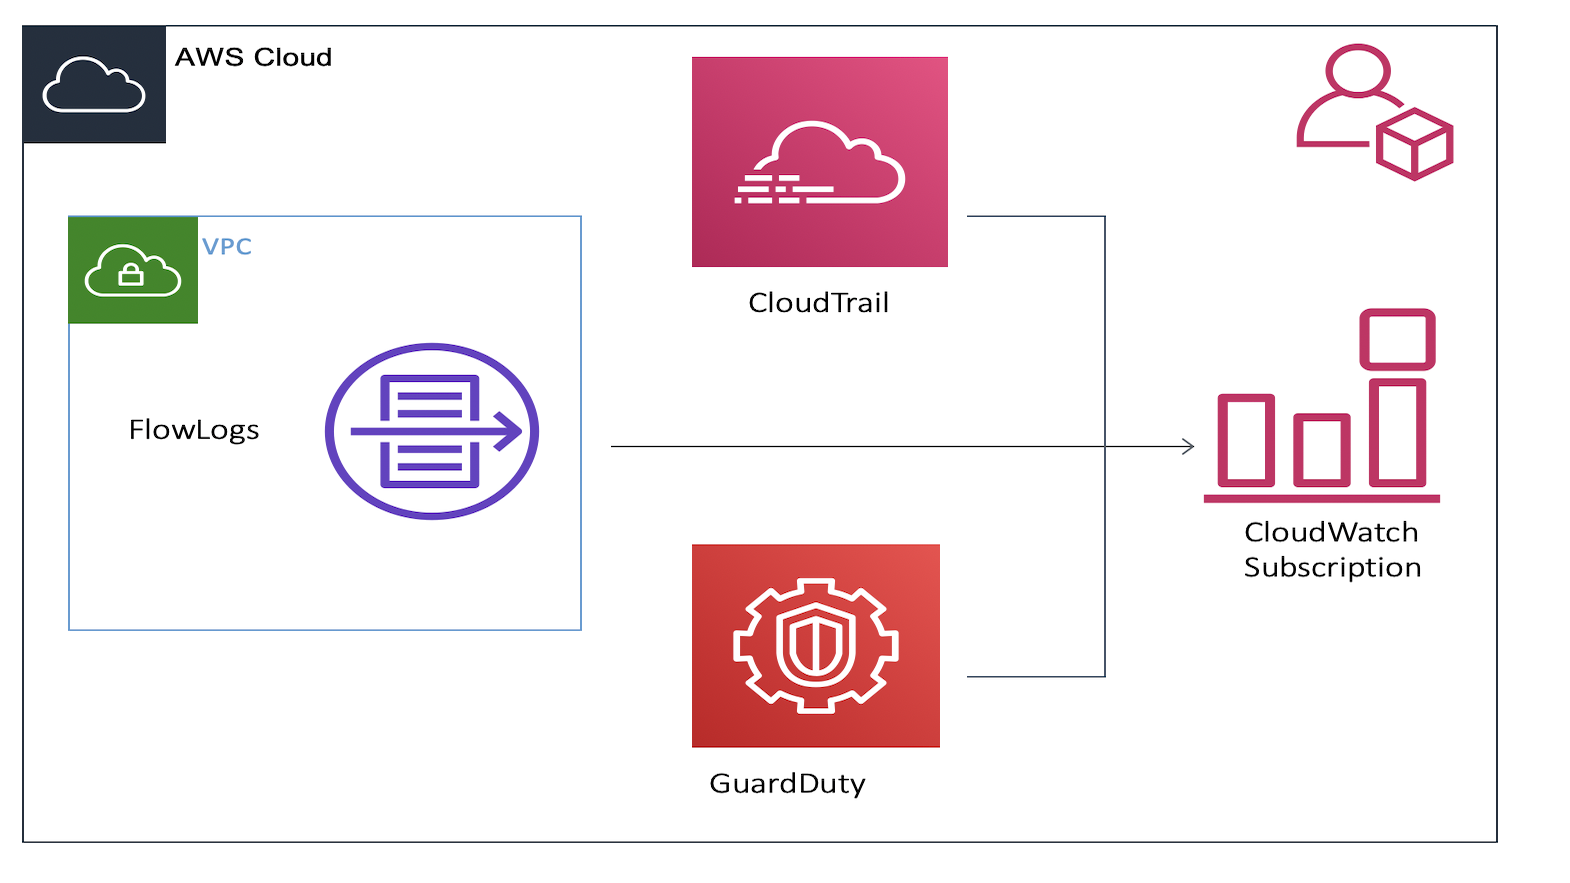
CloudTrail - This service tracks all of the API requests made across your AWS infrastructure. The API requests could be from the SDK, CLI, CloudFormation Template (CFT), Terraform or the AWS Console. This helps in identifying which users and accounts made API calls to AWS, the source IP from where the calls originated and when the calls occurred. It also tracks the changes, if any, that were made with the API request.
-
VPC Flow Logs - The VPC Flow Logs capture the IP traffic to and from the network interfaces within a VPC. This helps in monitoring the traffic that reaches your instances, diagnosing security group rules and determining the direction of traffic from the network interfaces.
-
GuardDuty events - This service detects suspicious activity and unauthorized behavior for users and resources. It focuses primarily on the account and network-related events. It uses threat intelligence feeds, such as lists of malicious IPs and domains, and machine learning to identify these threats. For ex: It can detect unusual patterns for a user accessing a resource. The user may have never used an API to request IAM info. This will be flagged by GuardDuty as it learns the user access patterns overtime and uses Machine Learning.
-
CloudWatch - CloudWatch collects monitoring and operational data in the form of logs, metrics, and events, providing you with a unified view of AWS resources, applications, and services that run on AWS.
-
Application Logs - These logs are generated from within the application. They are usually meant to capture errors and traces.
While I will be focusing on infrastructure logs (security events, API calls, Network flows) in this blog, the same method can be used even for application logs.
In this blog, I will review the basic concepts and discuss different ways of aggregating logs from AWS. In particular, I will review:
- Need for Log Aggregation and Analysis.
- Forwarding logs to a Centralized Logging Account in AWS
- Tradeoffs between different methods
In Part 2 of the blog, I will cover the actual implementation steps.
Need for Log Aggregation and Analysis
A common requirement from the security teams is to be able to analyze all the data collected across different accounts. The logs that are generated could be from Network flows, billing events or even API calls across a large number of cloud accounts. Some services, such as GuardDuty and CloudTrail, are regional which means that there is no single point where they can analyze the state and posture of the entire account. This problem becomes exponential when you have more than 1 account. Thus, aggregating the logs becomes very important.
In addition to this, the SecOps teams may not have the IAM “permissions” to access the member AWS accounts directly. Which again necessitates the need for Centralized Aggregation of logs.
Log analysis has a lot of benefits when implemented properly. Some of which are:
- Improves security awareness and faster detection of unwanted configuration modifications
- Identify resource usage across your accounts
- Detect anomalous patterns and IAM behaviors within accounts
- Demonstrating compliance with regulatory requirements
Let’s look at the steps involved in log analysis:
-
Aggregate the logs - As mentioned in the previous section.
-
Parse the logs - To extract essential information from all different logging services, the logs need to be parsed and fed to ElasticSearch or Splunk. This data transformation is used to either filter out to unnecessary logs or converts data into formats suitable for ELK, Splunk or RedShift. In some cases, the logs are compressed (.gzip) and sent to the destination in the Central logging account. So the transformation layer can be used to uncompress this file and extract individual logs.
-
Querying the logs - Querying the parsed log data enables to find greater insight into the data. This is where elastic search, Splunk or Amazon RedShift come into the picture.
-
Monitoring - Finally, building dashboards to analyze logs and metrics is crucial. Cloudwatch comes with various visualization options that can be built based on a query. Alarms can be set to trigger based on a particular condition.
Forwarding logs to a Centralized Logging Account in AWS
The first step is to understand all the possible services you want to collect information from. Then understand where this information is being stored in AWS or where/how you want to pull this information.
For simplicity, I will discuss the three main “management and governance” services from AWS where information is aggregated. Assuming most information is sent into these AWS services as an aggregation location for different “bits” within AWS.
However you might even want to pull information straight from the services, i.e. add fluentbit agents in EC2 to pull logs into Elasticsearch
- GuardDuty, in a Member account, can be configured to send findings directly to the “Master” / “Central” Account. Once the accounts are added in the “Central” account, all the member accounts receive an invitation which they need to accept. This ensures that there was a trust relationship established. Moving forward all the GuardDuty events will be sent to this Central account.
But do remember that GuardDuty is a regional service. This meant that I had to enable it in every region within all of my member accounts. This could be a tedious task. In my next blog, I will provide a Terraform template that will make it easier to enable it in member accounts as well as accept an invitation for GuardDuty.
-
CloudTrail is also a regional service. This needs to be enabled in every region within your member accounts. The logs can be forwarded to an S3 bucket for storage. The Cloudtrail events can also be used to trigger notifications if any change is detected. This is achieved by creating an event rule in CloudWatch and then triggering an SNS notification.
-
VPC flow logs need to be enabled on every single VPC. This can be done post VPC creation as well. Similar to the CloudTrail logs, these logs can either be delivered to an S3 bucket for long term storage or they can be direct CloudWatch log group to generate notifications based on specific patterns.
The log aggregation usually serves 2 main purposes and the destination for aggregation is based on the use case:
-
Real-time Observations and Alerting - If the goal is to get real-time alerts from within your different accounts then log destination should be CloudWatch Log Group. Cloudwatch can be configured to trigger based on specific events. This can later be processed by Kinesis or SQS (Simple Queuing Service).
-
Regulatory requirements and Auditing - If your organization has regulatory requirements for storing the logs for a specific amount of time then S3 is the appropriate destination. These logs can be then archived to S3 Glacier for long term storage. If real-time alerts are not a requirement then logs stored in S3 can be used along with AWS Glue and AWS RedShift for analytics.
When converting these steps to practical implementation, I tried 3 different deployment models.
Method 1 - CloudWatch plus Lambda Method
While implementing the steps described in previous sections, I first architecture I implemented leveraged the following services:
- CloudTrail, GuardDuty, VPC Flowlogs - Log generation
- CloudWatch - Log aggregator
- Lambda Functions - Parse the logs (uncompress .gzip and extract logs)
- AWS ElasticSearch (ELK stack)/ AWS RedShift - Ingest data, analyze, search and visualize data
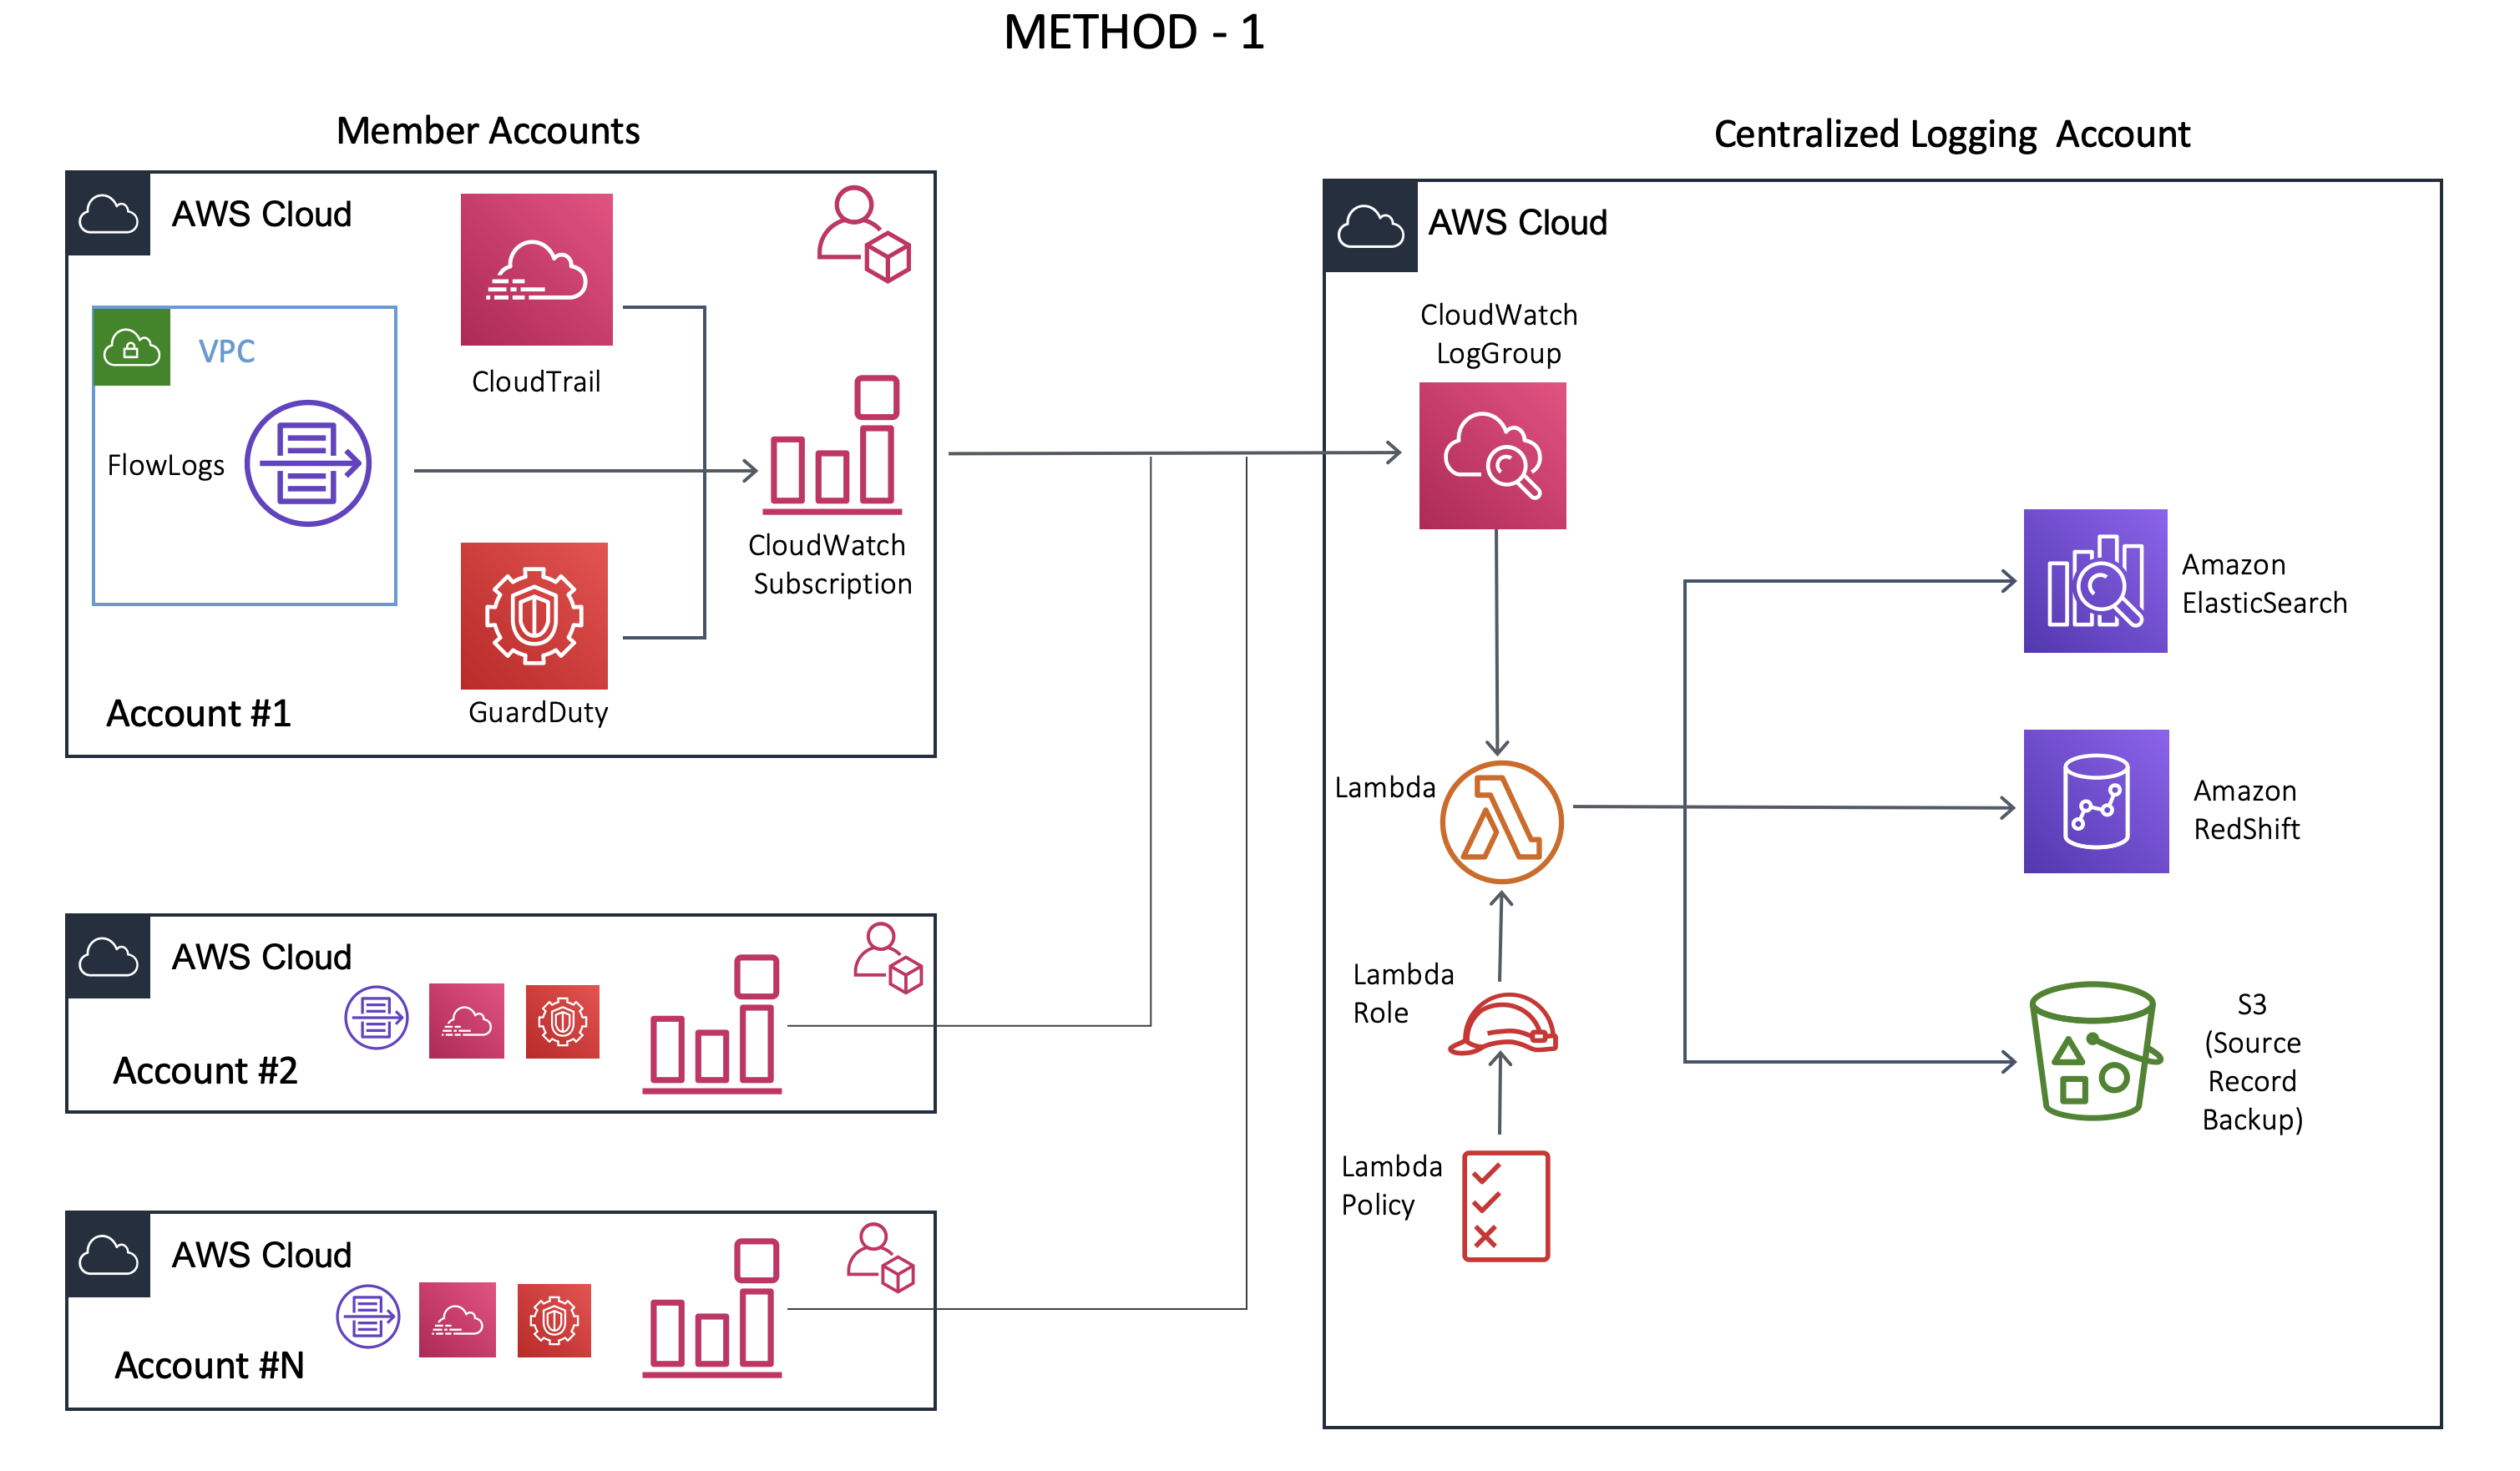
In this workflow, once the logs are collected, the parsing was done using LAMBDA function(s). Multiple CloudWatch event rules were configured to trigger a specific lambda based on the type or source of a log which could be GuardDuty, CloudTrail, VPC Flow logs. The data can then be sent to log analysis tools like Splunk, ElastiSearch or AWS RedShift.
This worked fine with a smaller number of events. But when the number of events increased, I started noticing that some of the events/logs were not sent to ElasticSearch.
After some debugging, I realized that the issue was related to Lambda Throttling. AWS has limits of 1000 lambda functions running concurrently. This includes all the lambda functions that you might be using for your other applications plus the lambda functions used for log processing.
Once this limit is exceeded Lambda started returning 429 error code. Even setting a reserved concurrency for the log processing function was not sufficient because when the number of log processors exceeded the reserved limit, the lambda function again returned 429 code.
You can request AWS to increase the concurrency limit within your account but this usually ends up being a catch-up game unless you can exactly predict how many functions you would need in each region.
Method 2 with AWS SQS
To overcome the drawbacks from Method 1, I added SQS between the CloudWatch Logs group and Log processing lambda functions as shown below.
- SQS - Simple Queue Service - It is a fully managed “Message Queue” service from AWS. It allows us to send, receive and store messages without losing them. A message could be any data that your services would like to send/receive from each other.
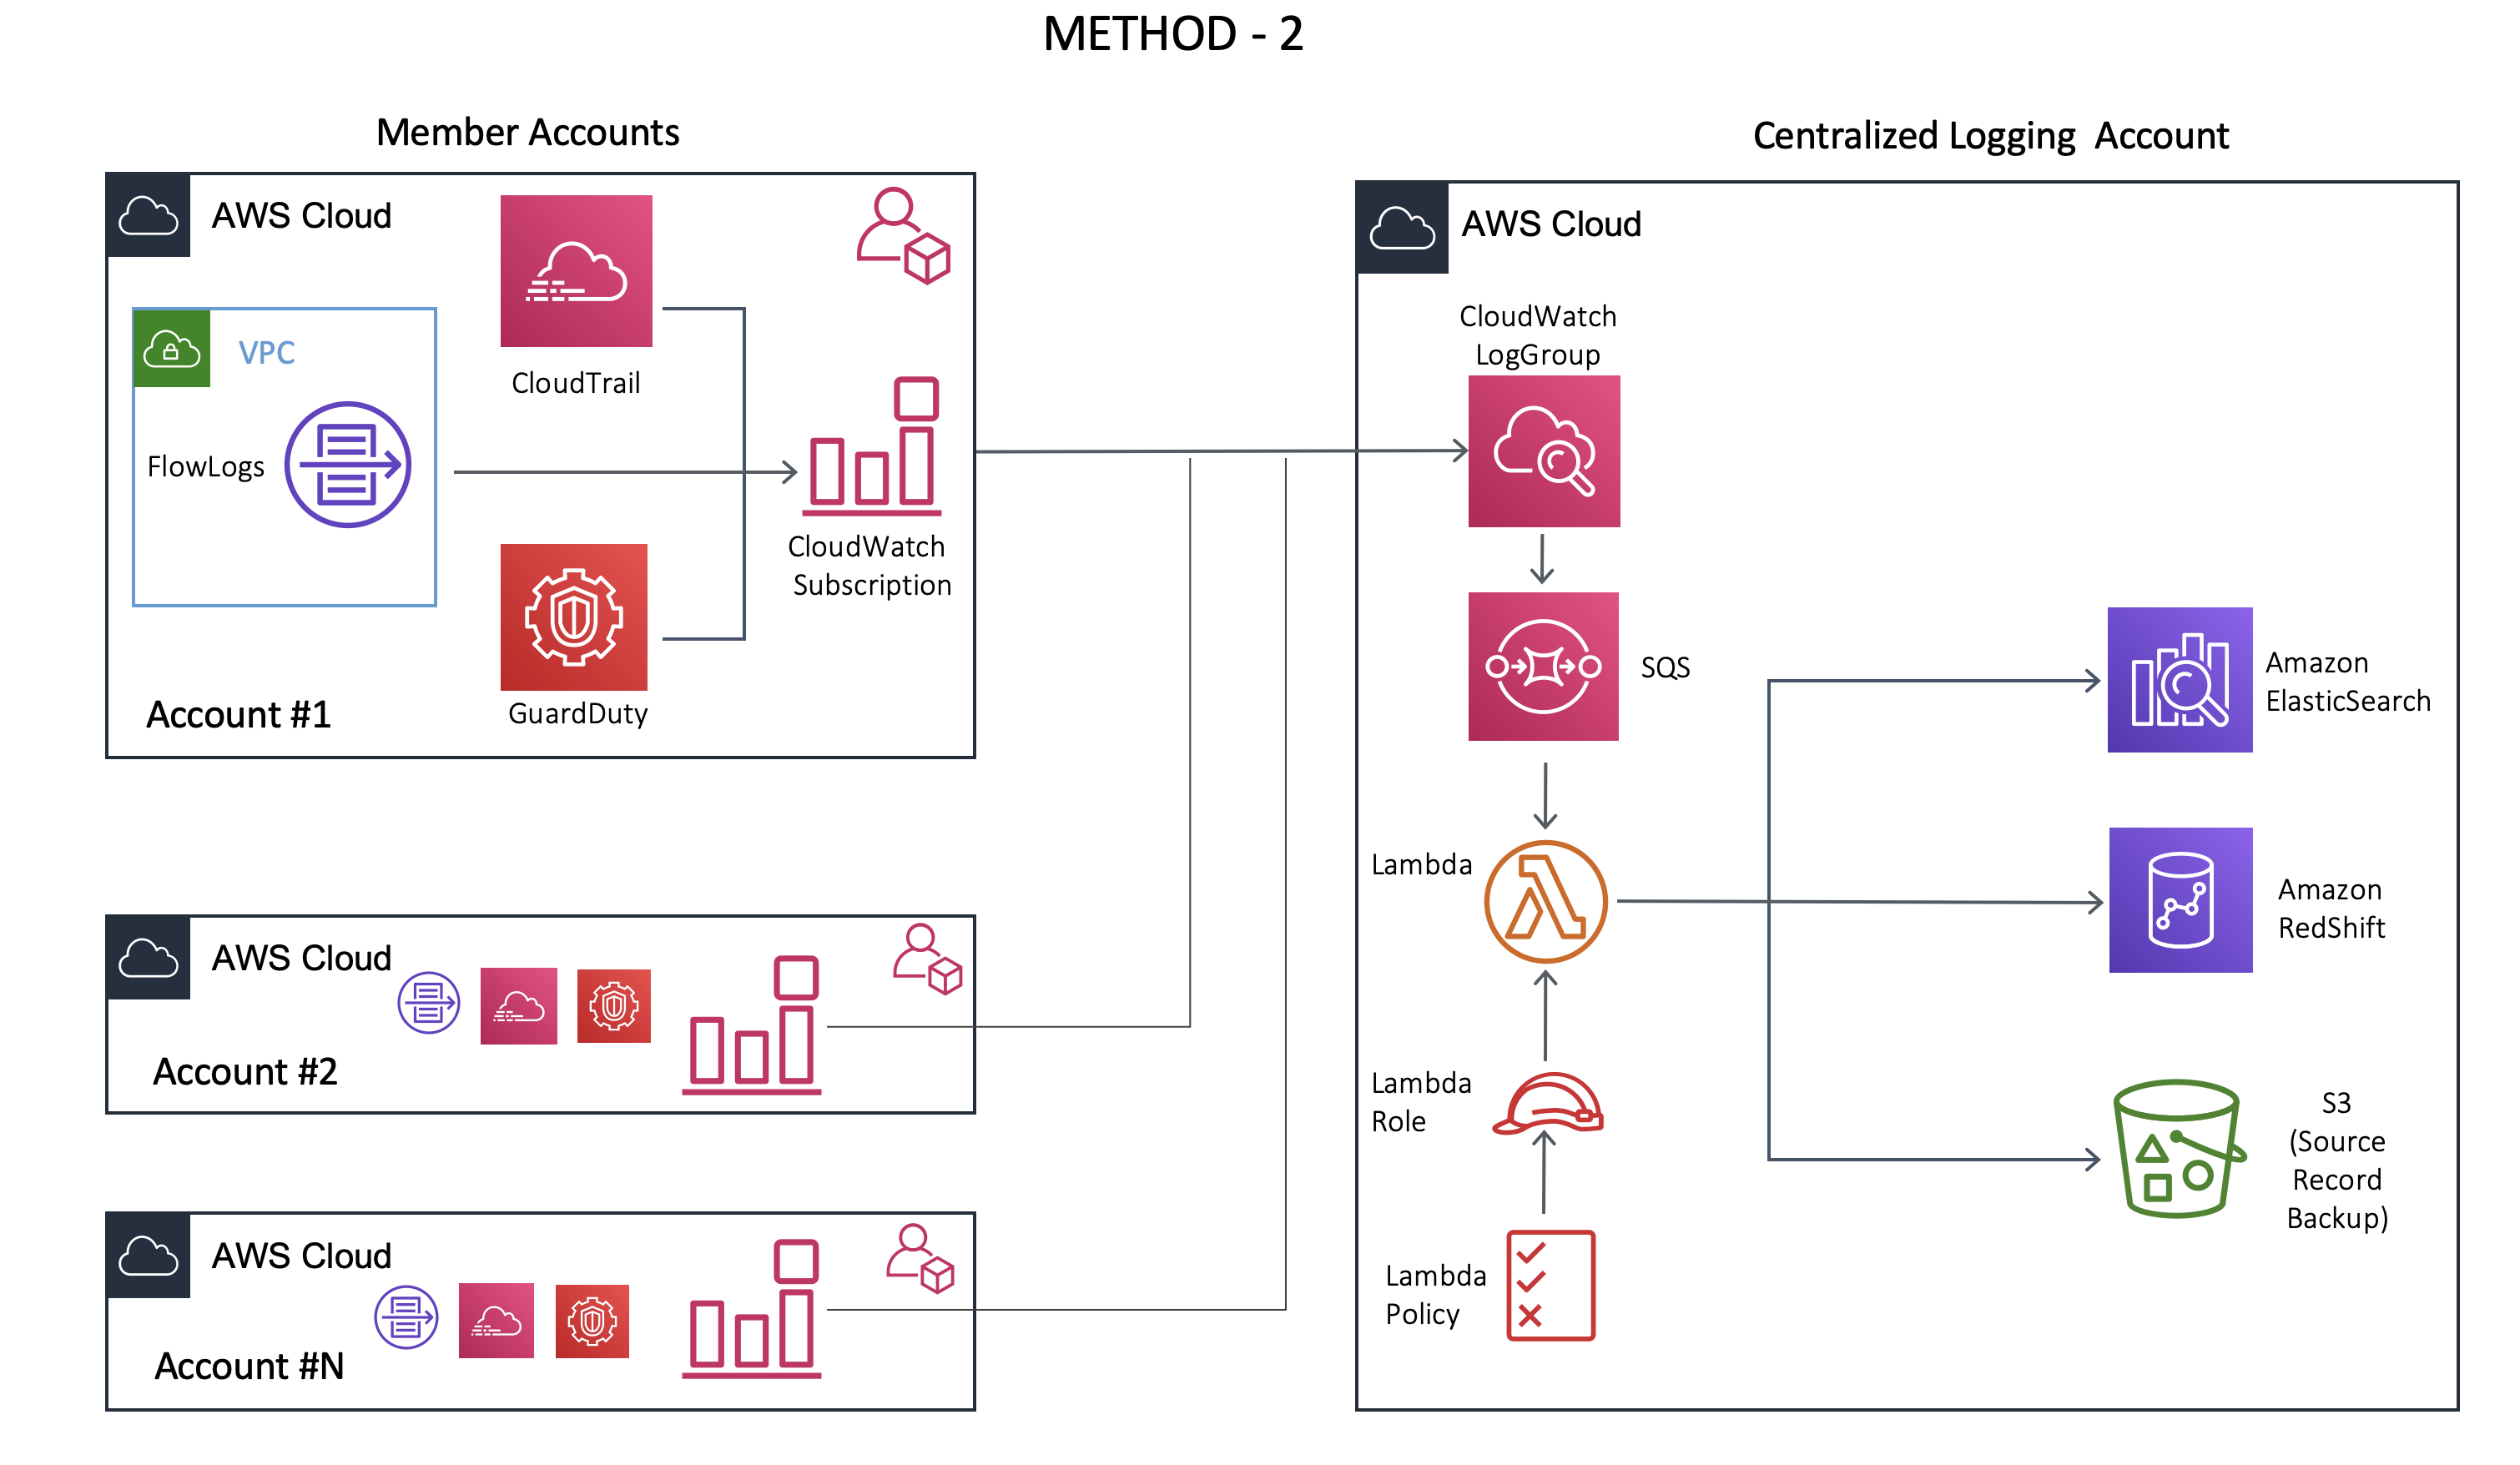
With SQS in place, now processing the event/log messages was easier. This was possible because SQS could store messages without losing messages and need for a receiver, like a lambda function, to be available for processing. This meant that even after the account limit for lambda was reached, the event messages were still there in the queue. And once the number of concurrent Lambda executions decreased, the next available execution of the function would pick up the message and process it.
This method also has some limitations. While SQS has advantages concerning easy setup and increased read throughput, it does not support multiple consumers and message replaying capability.
What this means is, for some reason if the lambda function takes longer than expected for processing the log messages or if it crashed due to an unexpected error, the message would be permanently removed from the SQS queue. This would lead to the loss of some logs that would never be processed and won’t be available for analysis.
Method 3 with AWS Kinesis
This was the final method that I tried that addressed the drawbacks of both method 1 and method 2. I used the following additional services in the Central Logging Account:
-
AWS Kinesis Data Stream - It’s a real-time data streaming service that can capture gigabytes of data per second. It can store the messages up to 7 days (the Retention period can be modified). It’s used in real-time analytics and video streaming applications. This data stream can be customized based on the user’s needs.
-
AWS Kinesis Firehose - It’s a fully managed real-time delivery streaming service that can load data into other endpoints such as S3, RedShift or AWS ElasticSearch. It can also transform the data if needed. Firehose does not have a retention period.
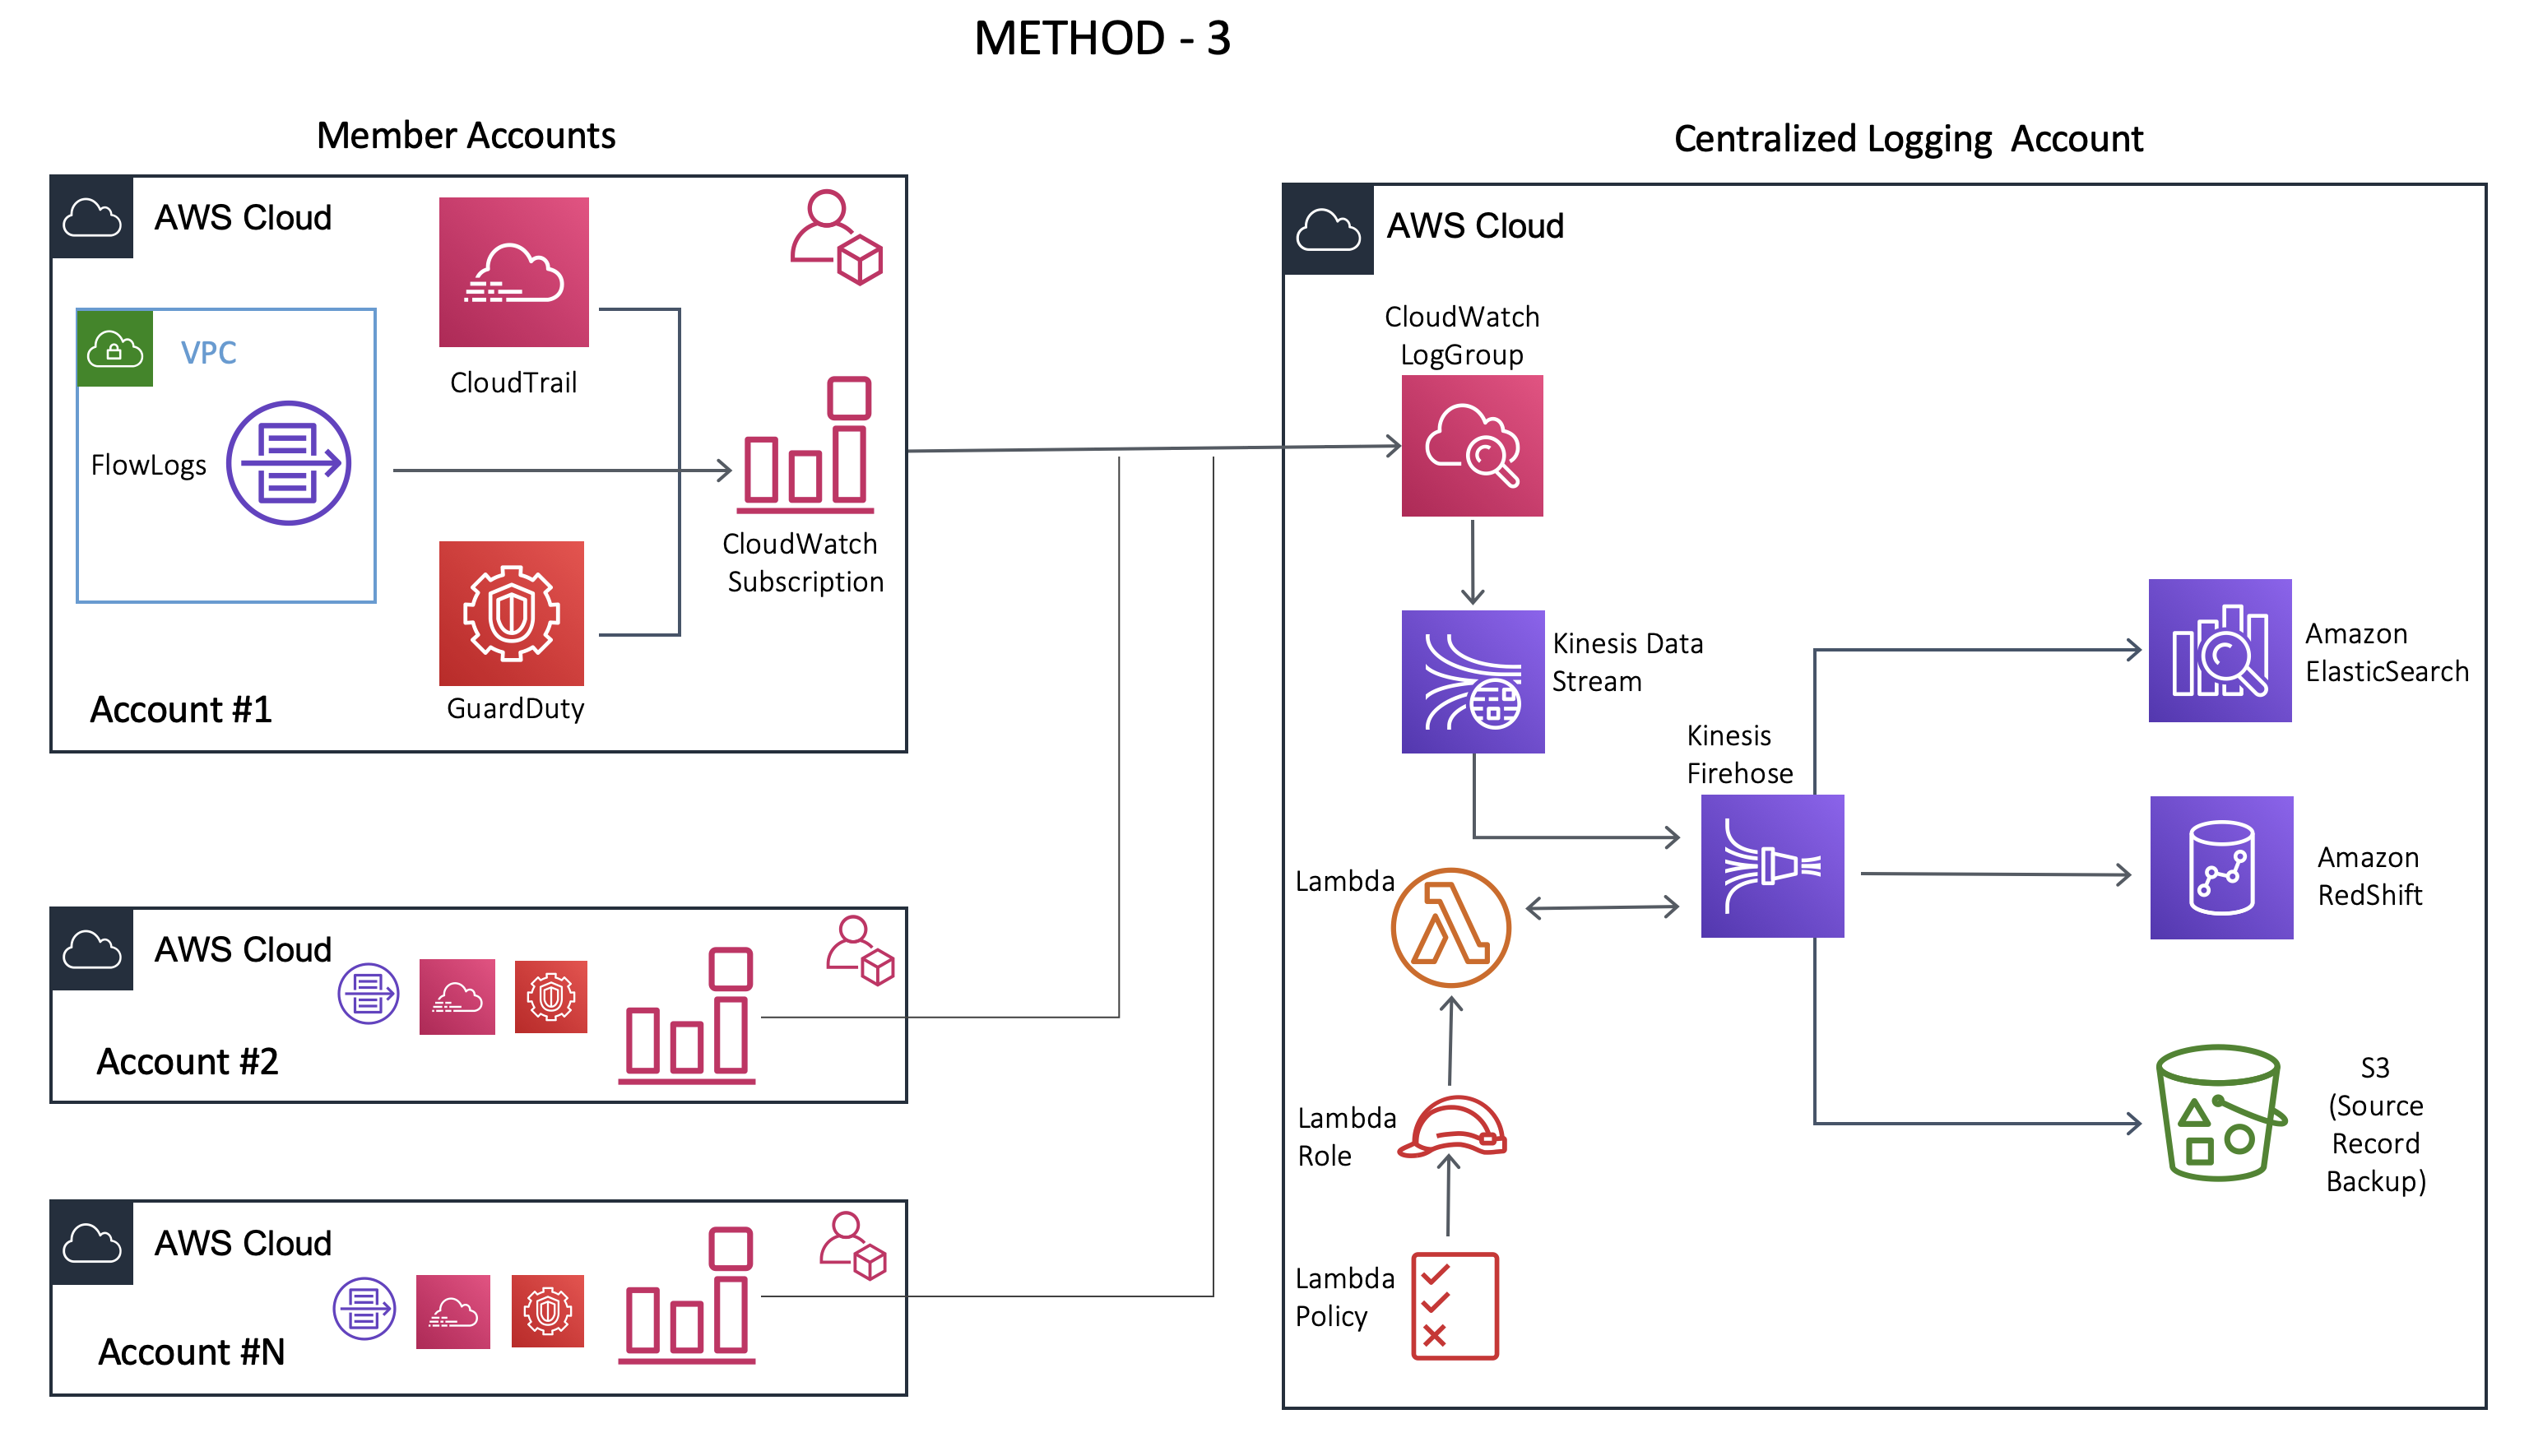
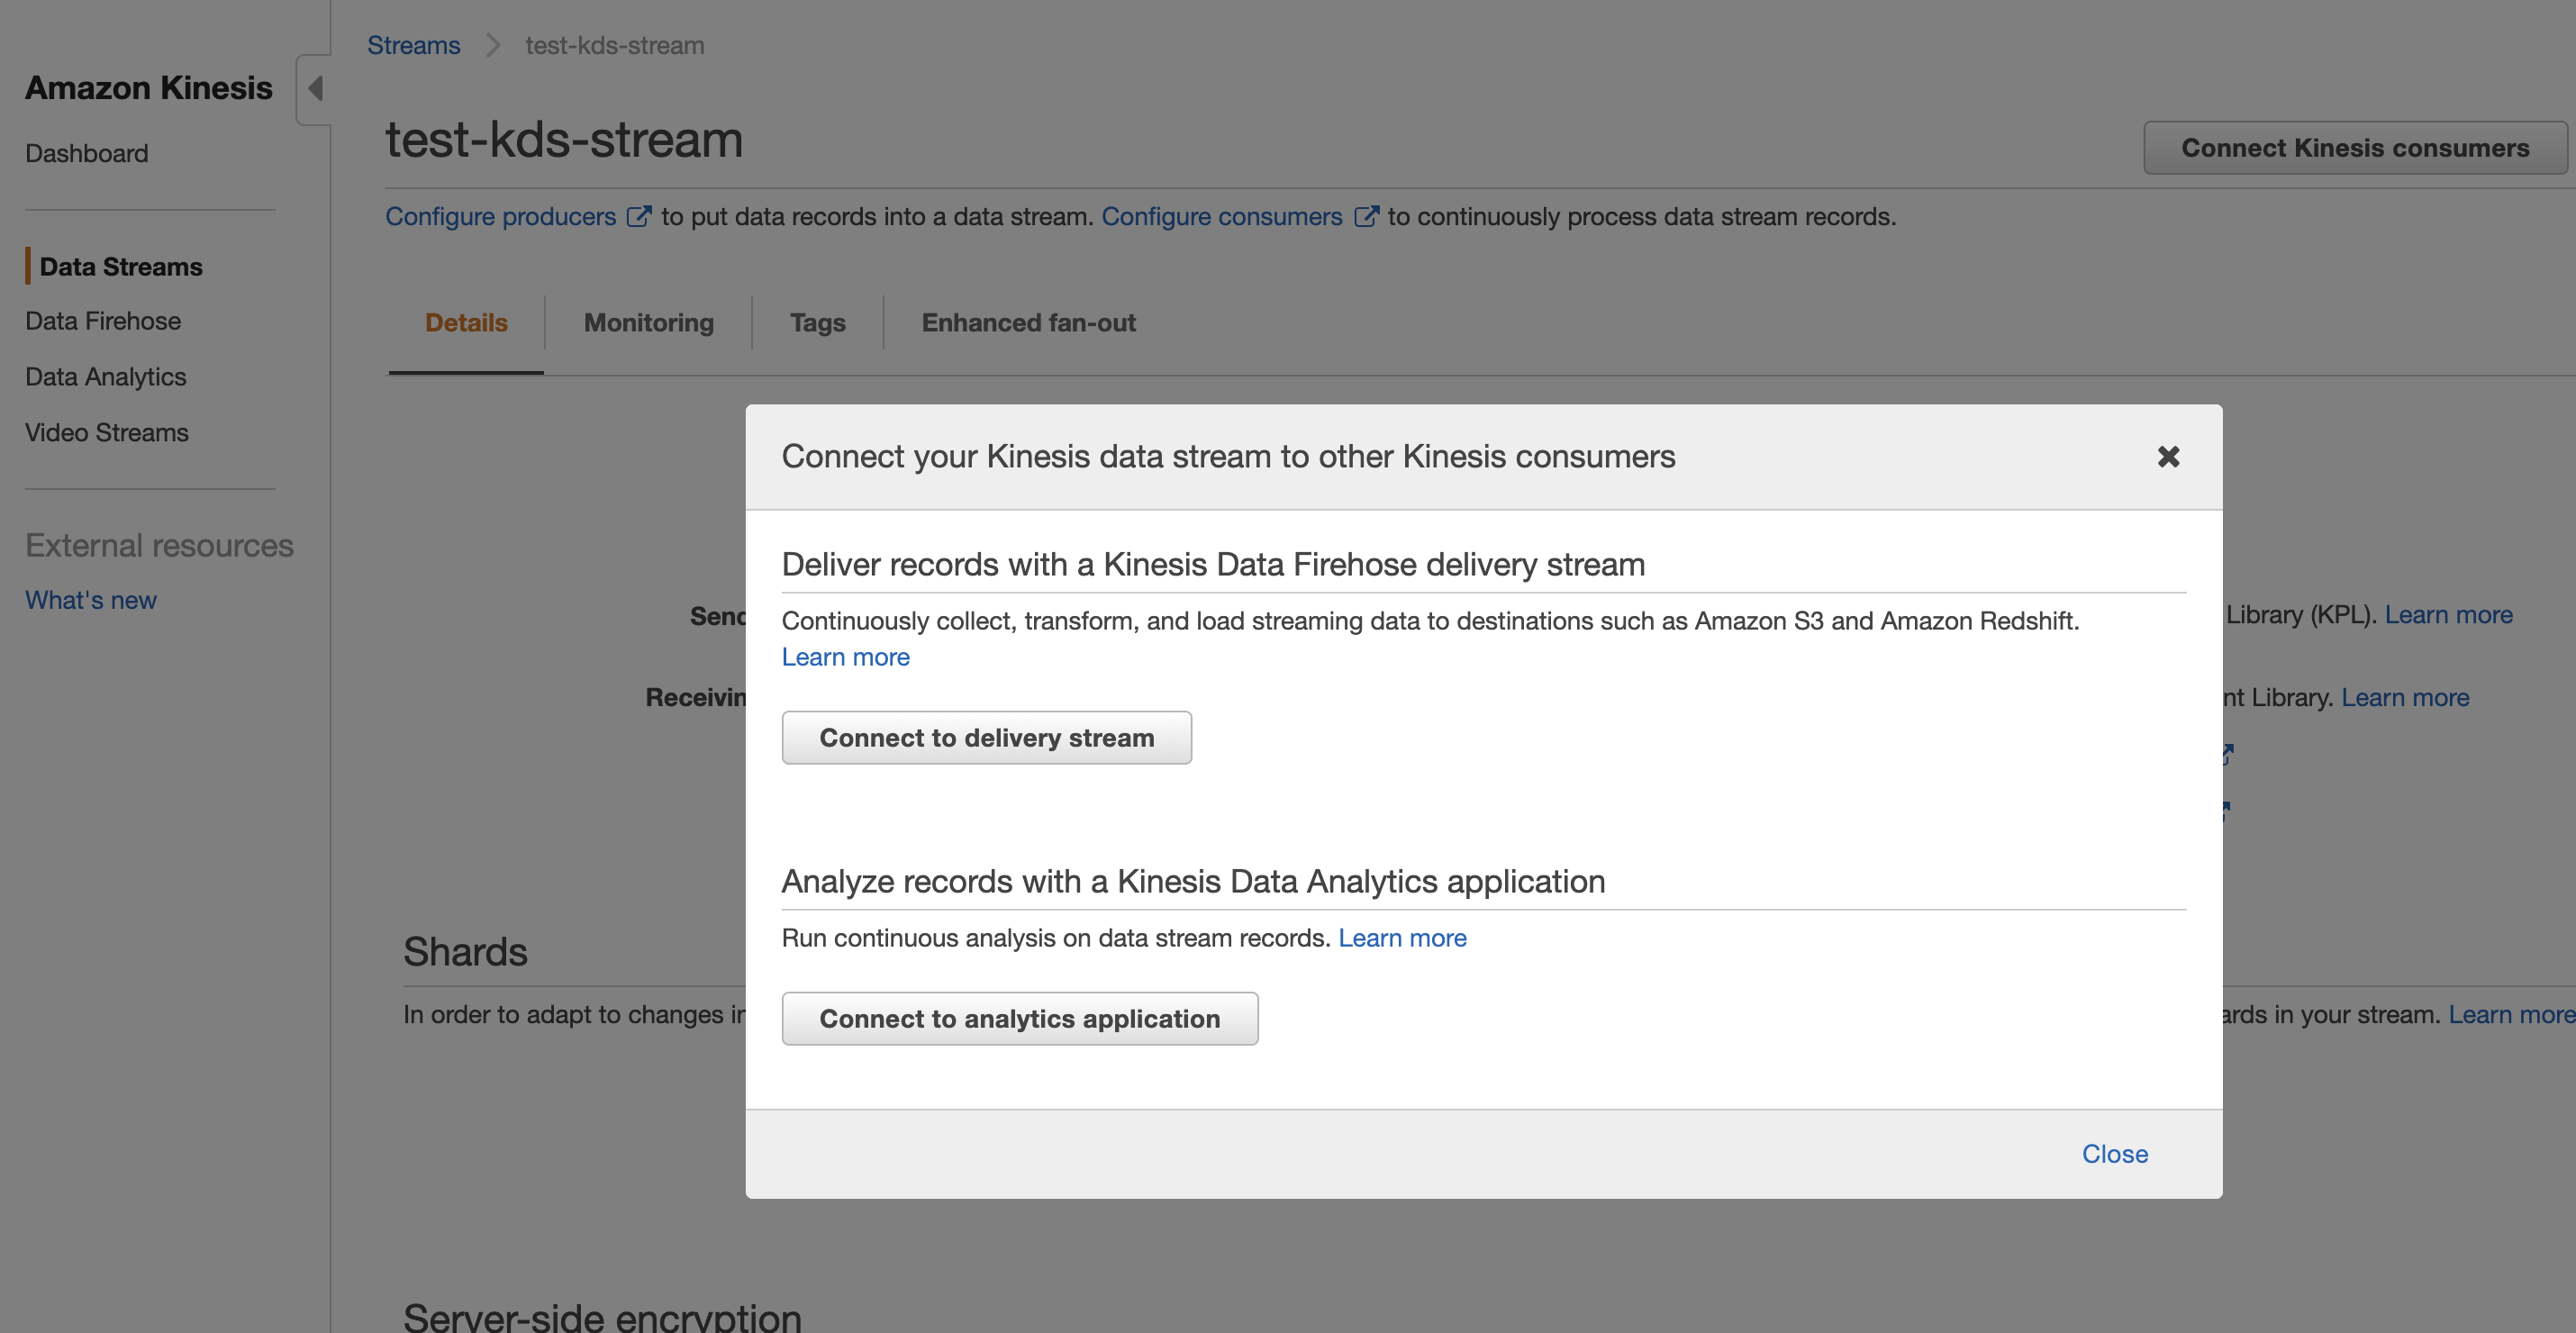
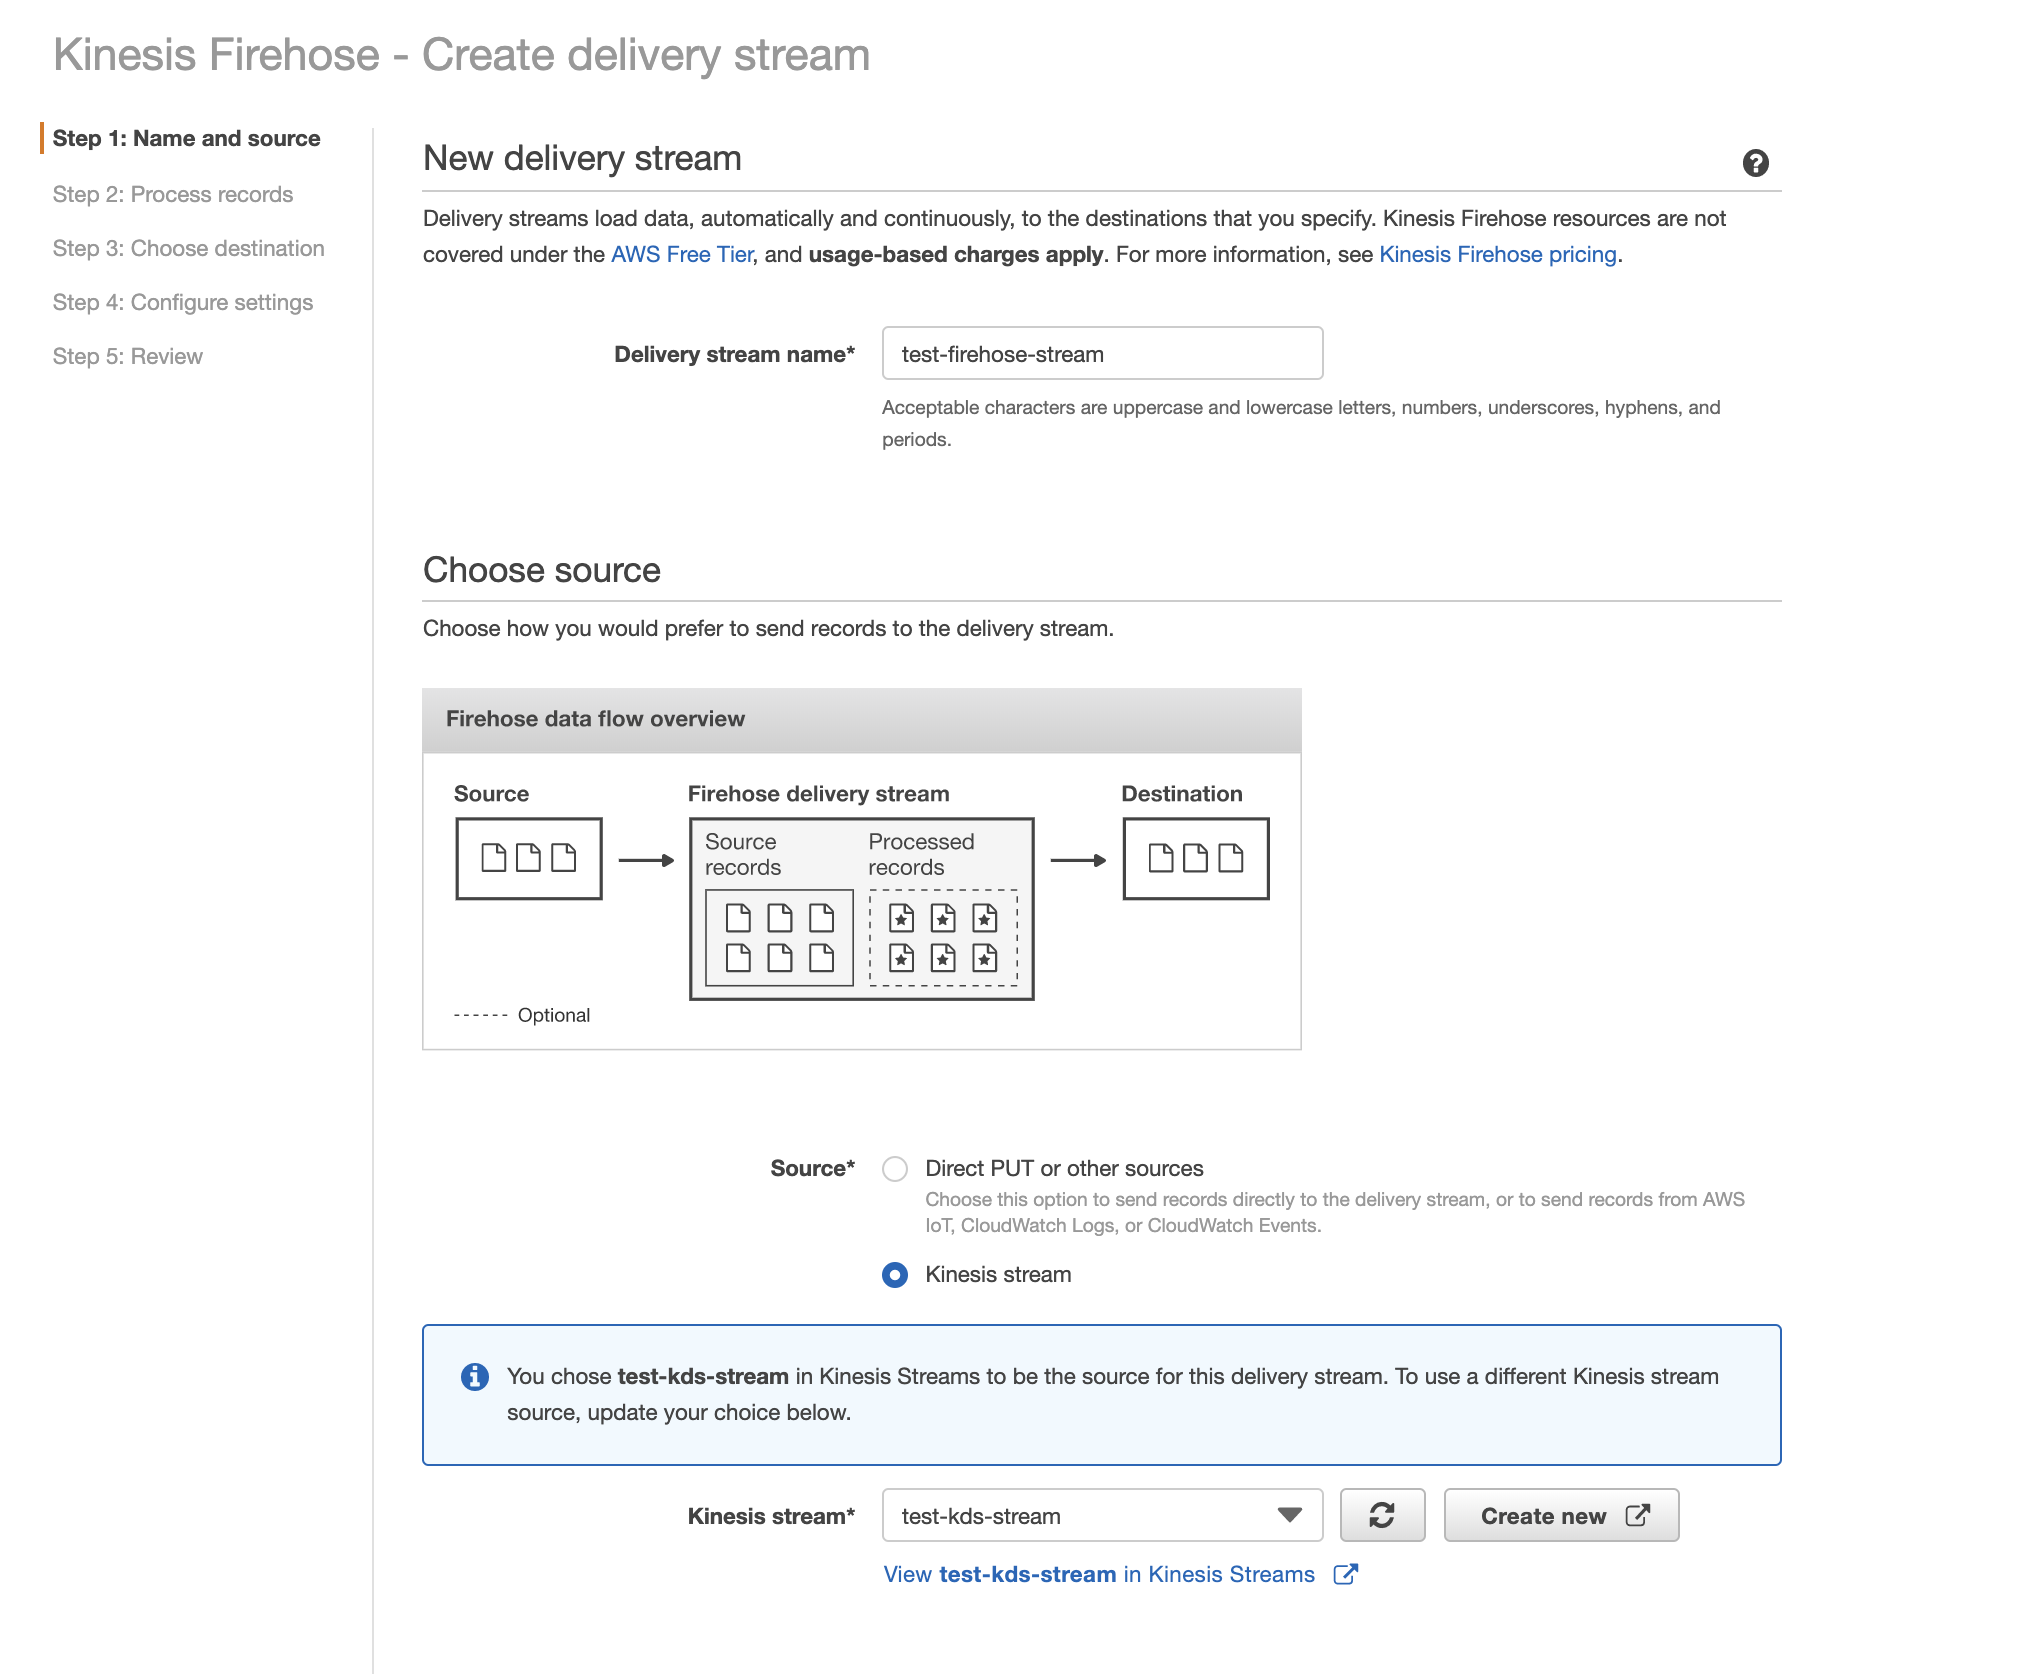
This method uses AWS Kinesis Data Stream and Firehose Delivery Stream in the log processing workflow as shown above.
Cloudwatch pushes the logs into Kinesis Data Stream (KDS). The Kinesis Firehose delivery stream reads the messages from the Kinesis data stream (KDS) and integrates with lambda for data transformation.
It’s very simple to set up the integration between KDS and Firehose. (Step by step details will be discussed in part 2 of the blog)
With this in place, even if the lambda functions failed halfway through, the messages are retained in the Kinesis data stream. This message can be picked up by another function and can be processed. Kinesis also can mark the messages within a queue that allows the functions to decide which message should be picked next. Also, in the case of KDS, the number of shards is the unit of concurrency of lambda functions. For ex: If you have 50 active shards, then there will be at most 50 lambda functions executing. This adds more predictability to log processing lambda functions.
Finally, AWS Firehose loads the extracted data into ElasticSearch, RedShift or S3.
Now that we understand why Method 3 is most suitable, I will discuss this in detail with steps on how to implement it in the next blog.
Trade offs
Let’s now look at some of the tradeoffs across different methods
-
Method 1 - This method is the easiest to set up because of the minimal number of services interacting but it will not scale when very large amount of logs are being sent for processing. This method might be sufficient if you have very few accounts and logs.
-
Method 2 - This method requires the setup of SQS. It allows for the decoupling of producers and consumers. This allows for log processing functions to scale independently. The cost might be higher than method-1 because of the SQS along with increased complexity. Another disadvantage is that the messages are removed from the queue once they are read, providing no scope for retention. There is also a lack of continuous monitoring of CloudWatch metrics for the SQS. As of writing this blog, CloudWatch metrics for SQS are available only at intervals of 5 min.
-
Method 3 - This method requires the setup of Kinesis Data Stream and Firehose. It allows for multiple producers and consumers. It provides a retention period and the ability to add multiple consumers. But it increases the complexity drastically. Modifying the number of shards after provisioning of the KDS stream is tricky and requires some advanced knowledge of how streams operate. The cost also increases because of 2 additional services being added to the log processing workflow.
Conclusion
Central logging is required when the number of cloud accounts starts increasing. This provides the SecOps teams an easier way to analyze data from multiple sources for managing security, compliance and application analytics.
AWS lambda usually is used for log processing because of its event-based nature (Does not need a VM or container to be running if logs aren’t there to process). It comes with its limitations.
Since events in the multi-account environment tend to increase exponentially, a scalable and real-time data stream is needed for shorter detection periods. This is provided by services like AWS Kinesis.